
- Moving the markets
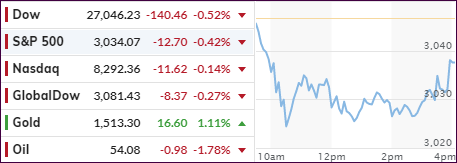
Despite the Fed’s market pleasing efforts yesterday, it appears that the US-China trade talks, or rather the lack thereof, have enough power left to affect market direction. Such was the case this morning when a report said that “Chinese officials have doubts about the prospects for a long-term trade deal with the US.”
Attempting to dampen the subsequent fall of equities, Trump came out and announced that a “transitional deal” would be still signed soon, although the warring parties need to pick a new site for this event, as the previous host, Chile, canceled the mid-November summit.
Just the fact that the Dow was down a “shocking” 240 points this morning caused all kinds of action by the administration, as economic advisor Kudlow came out and attempted to jawbone the markets higher with goodies like “US-China talks going smoothly.” It did have a momentary positive effect, as this chart shows.
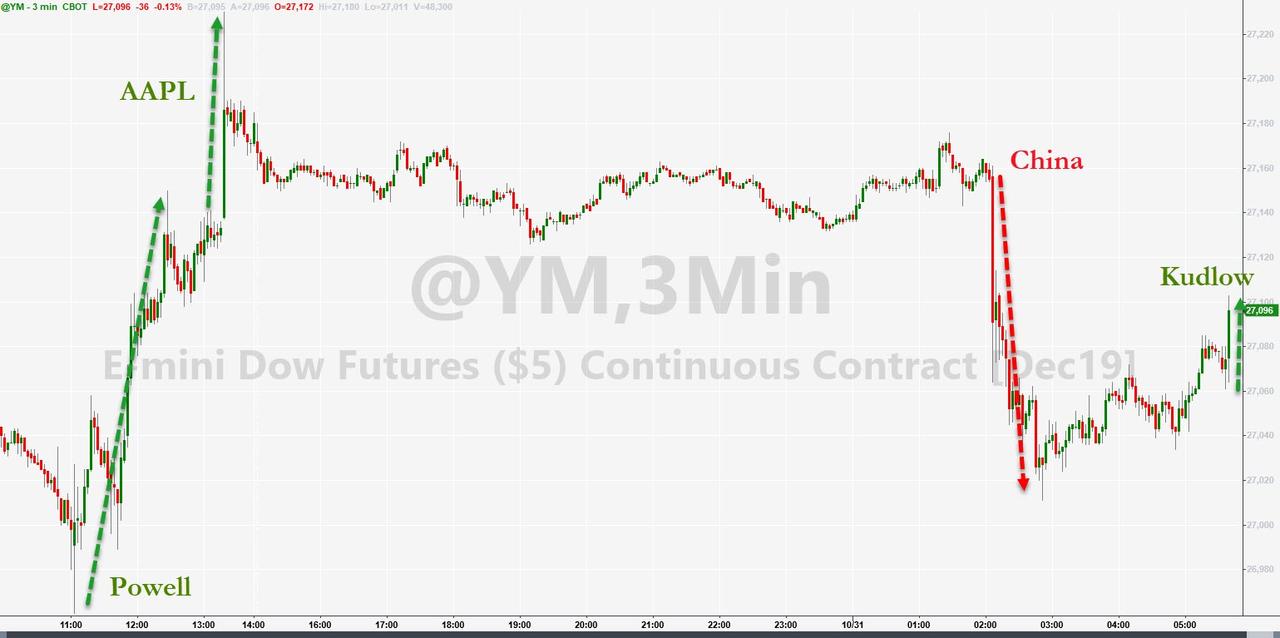
Then the blame game continued with Trump seething that “China’s not our problem, The Fed is.” You almost have to laugh at the silly notion that it seems no longer acceptable to have a minor correction, let alone a normal downturn as part of the business cycle. But that’s the world we live in, and we must deal with it.
In the end, the month of October, also known as the bull market killer, turned out better than expected, although it started out on a negative note with a 2-day sell-off. That was short-lived, and we seesawed higher with the S&P 500 closing the month with a respectable +1.9% gain.
It’s low volatility cousin, SPLV, did not fare as well and got blindsided by bond yields, which rose despite the Fed’s easing efforts. Just like in September, this chart shows the rebound in the 10-year yield (blue arrows), which affected SPLV negatively due to its interest rate component. Even though, SPLV gave back -0.58% this month, it remains ahead of the S&P 500 in YTD ‘Buy’ cycle performance.
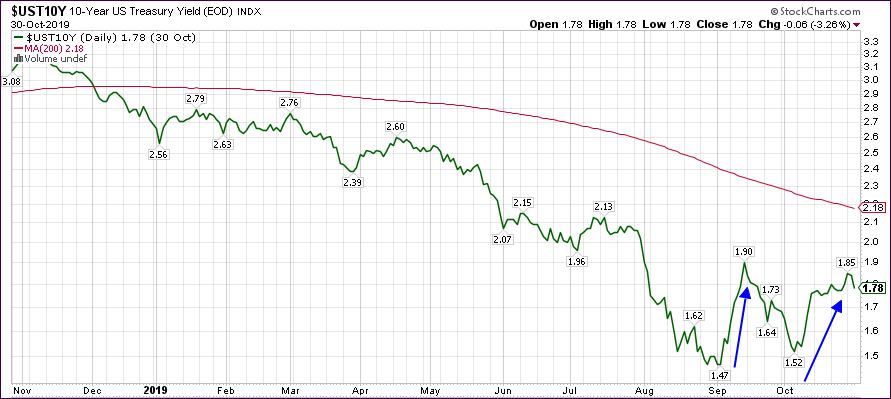
2. ETFs in the Spotlight
In case you missed the announcement and description of this section, you can read it here again.
It features 10 broadly diversified and sector ETFs from my HighVolume list as posted every Saturday. Furthermore, they are screened for the lowest MaxDD% number meaning they have been showing better resistance to temporary sell offs than all others over the past year.
The below table simply demonstrates the magnitude with which some of the ETFs are fluctuating regarding their positions above or below their respective individual trend lines (%+/-M/A). A break below, represented by a negative number, shows weakness, while a break above, represented by a positive percentage, shows strength.
For hundreds of ETF choices, be sure to reference Thursday’s StatSheet.
For this current domestic “Buy” cycle, here’s how some our candidates have fared:
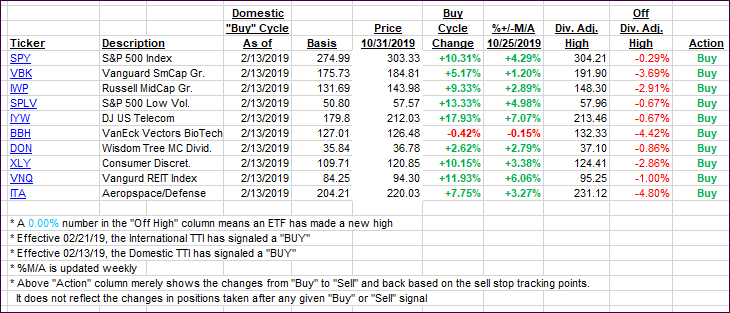
Again, the %+/-M/A column above shows the position of the various ETFs in relation to their respective long-term trend lines, while the trailing sell stops are being tracked in the “Off High” column. The “Action” column will signal a “Sell” once the -8% point has been taken out in the “Off High” column. For more volatile sector ETFs, the trigger point is -10%.
3. Trend Tracking Indexes (TTIs)
Our Trend Tracking Indexes (TTIs) slipped as the major indexes faded all day but managed a last hour rebound.
Here’s how we closed 10/31/2019:
Domestic TTI: +3.98% above its M/A (prior close +4.52%)—Buy signal effective 02/13/2019
International TTI: +2.14% above its M/A (prior close +2.48%)—Buy signal effective 10/29/2019
Disclosure: I am obliged to inform you that I, as well as my advisory clients, own some of the ETFs listed in the above table. Furthermore, they do not represent a specific investment recommendation for you, they merely show which ETFs from the universe I track are falling within the specified guidelines.
Contact Ulli