
- Moving the markets
As was expected, the Fed cut interest rates by 0.25%, and analysts were salivating all over the language in the accompanying statement, in order to see what might have been said different this time.
The wording shifted slightly to a more hawkish stance from:
“…will continue to monitor the implications of incoming information for the economic outlook and will act as appropriate to sustain the expansion, with a strong labor market and inflation near its symmetric 2 percent objective.”
To:
“The Committee will continue to monitor the implications of incoming information for the economic outlook as it assesses the appropriate path of the target range for the federal funds rate.”
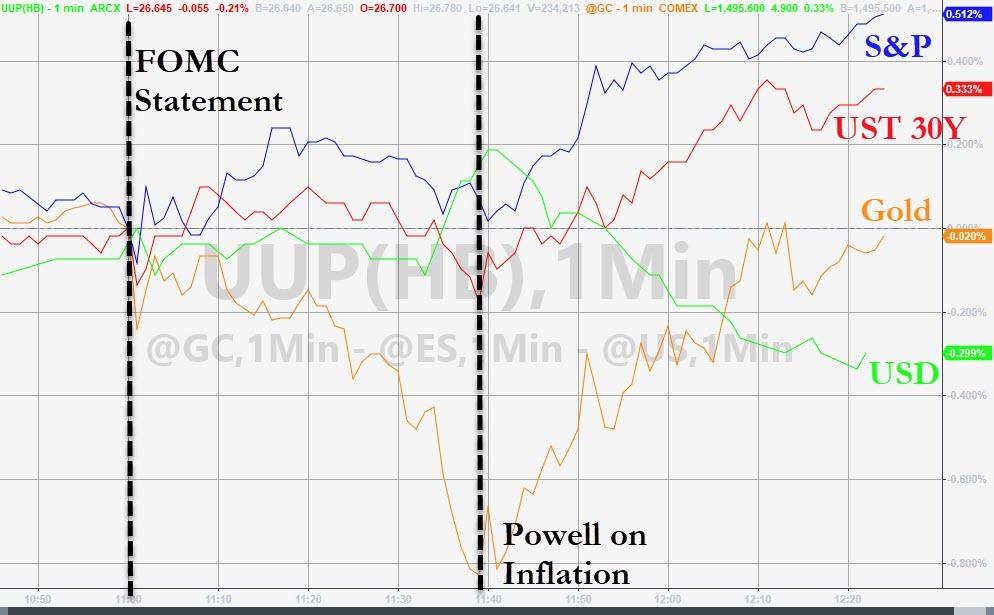
Then Fed chair Powell suggested that “I think we would need to see a really significant move up in inflation that’s persistent before we even consider raising rates to address inflation concerns.” That was the icing on the cake that got the computer algos started, and the major indexes spiked and closed in the green.
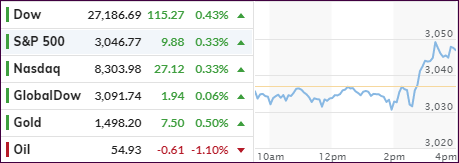
To no surprise, interest rates dropped today with the 10-year bond yield sliding over 6 basis points, which gave a nice assist to the low volatility ETF SPLV, which added +0.73% vs. the more modest performance of the S&P 500 (SPY), which rose +0.33%.
The question now is “can equities trek higher without the Fed’s assistance?” It appears right now that there will be no cut in December (76% odds), so that hope factor is off the table for the time being.
Despite Trump tweeting that we have “The Greatest Economy in American History,” the factual GDP numbers paint a slightly different picture. The US economy, according to ZH, grew at a 1.9% annualized rate, well above the 1.6% expected, but still below the already weak Q2 print of 2.0%, and matching the second weakest reading of the Trump administration.
Yet, the S&P 500 hovers in record territory, which makes it abundantly clear, contrary to common view, that the stock market and the economy are totally disconnected from each other.
2. ETFs in the Spotlight
In case you missed the announcement and description of this section, you can read it here again.
It features 10 broadly diversified and sector ETFs from my HighVolume list as posted every Saturday. Furthermore, they are screened for the lowest MaxDD% number meaning they have been showing better resistance to temporary sell offs than all others over the past year.
The below table simply demonstrates the magnitude with which some of the ETFs are fluctuating regarding their positions above or below their respective individual trend lines (%+/-M/A). A break below, represented by a negative number, shows weakness, while a break above, represented by a positive percentage, shows strength.
For hundreds of ETF choices, be sure to reference Thursday’s StatSheet.
For this current domestic “Buy” cycle, here’s how some our candidates have fared:
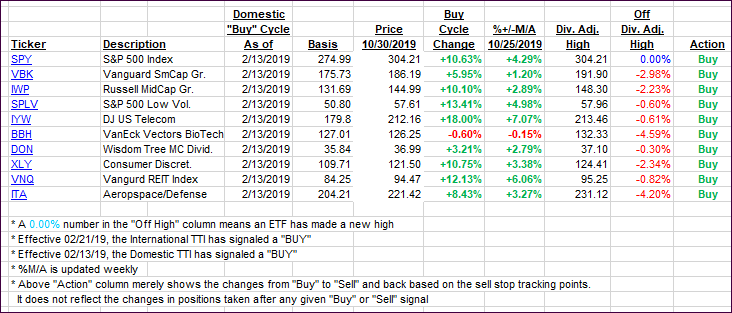
Again, the %+/-M/A column above shows the position of the various ETFs in relation to their respective long-term trend lines, while the trailing sell stops are being tracked in the “Off High” column. The “Action” column will signal a “Sell” once the -8% point has been taken out in the “Off High” column. For more volatile sector ETFs, the trigger point is -10%.
3. Trend Tracking Indexes (TTIs)
Our Trend Tracking Indexes (TTIs) changed only immaterially, as today’s rebound was not broad based.
Here’s how we closed 10/30/2019:
Domestic TTI: +4.52% above its M/A (prior close +4.51%)—Buy signal effective 02/13/2019
International TTI: +2.48% above its M/A (prior close +2.54%)—Buy signal effective 10/29/2019
Disclosure: I am obliged to inform you that I, as well as my advisory clients, own some of the ETFs listed in the above table. Furthermore, they do not represent a specific investment recommendation for you, they merely show which ETFs from the universe I track are falling within the specified guidelines.
Contact Ulli