
- Moving the markets
Yesterday’s attempt by Trump to put some lipstick on the trade pig, via a possible delay of certain tariffs, now seems to have had only a one-day effect with global realities taking front and center.
Newly released data shows a worrisome development regarding economic growth with China and Europe’s economic powerhouse Germany both presenting weak data. Chinese production slowed to 4.8% YoY, its lowest level since 2002, while retails sales came in way below consensus. But at least they’re showing positive numbers.
That can’t be said for Germany, which showed its GDP contracting -0.1% in the second quarter, the first time since the 3rd quarter of 2018. Much is contributed to the impending Brexit later this year.
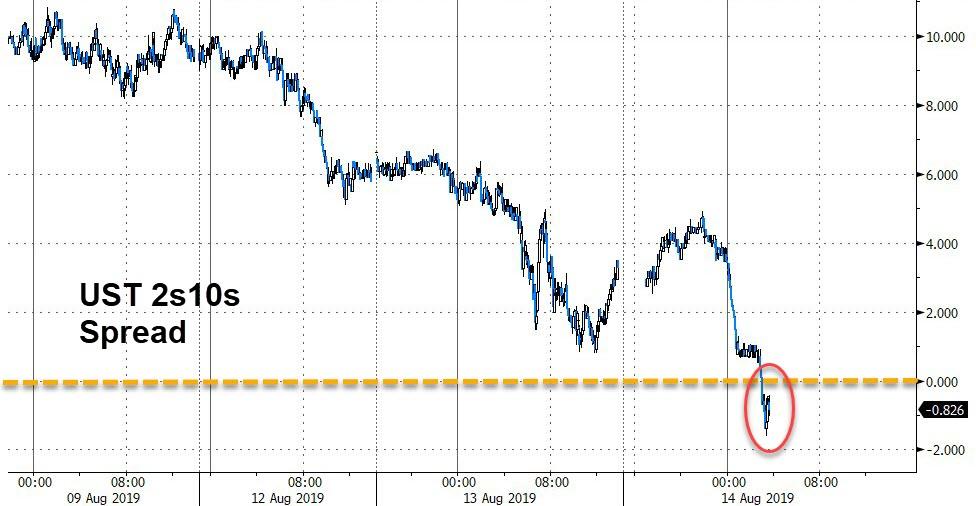
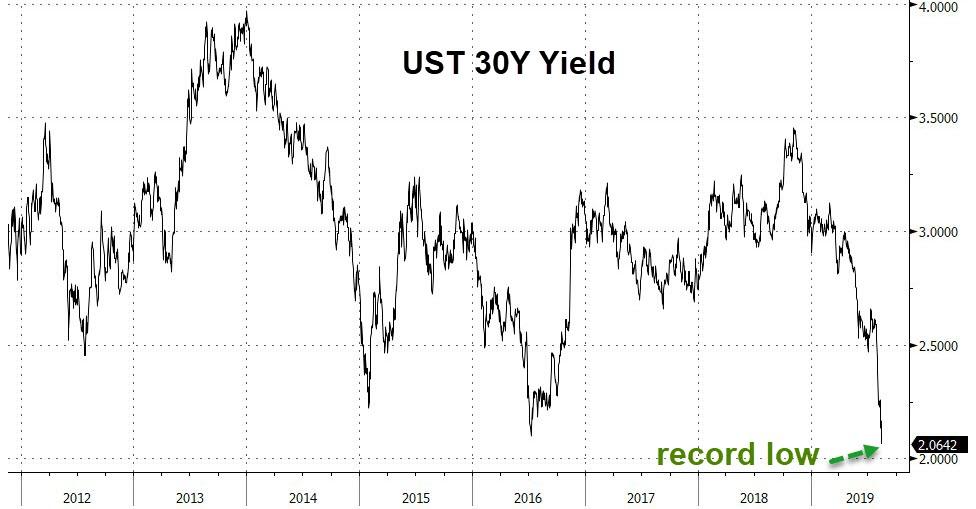
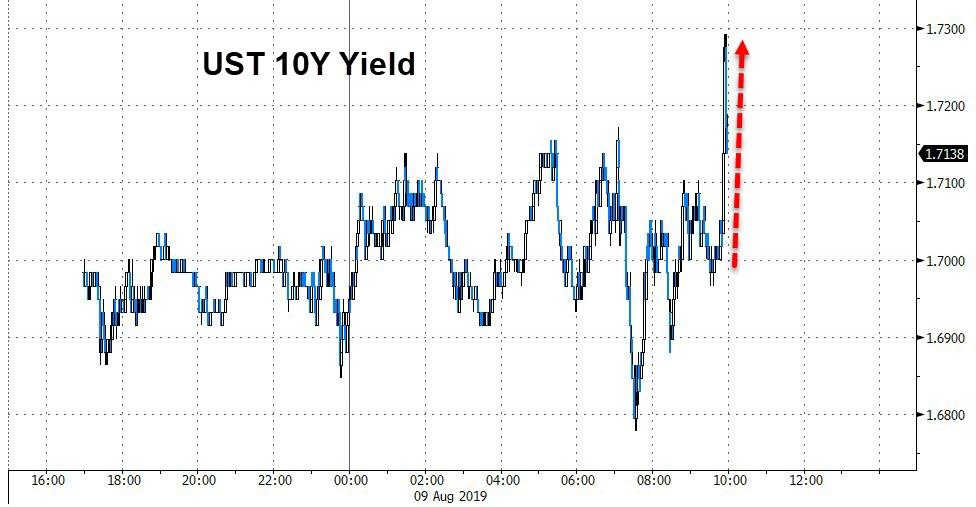
But the nail in the market’s coffin, at least for today, was the bond market where the 2/10 yield inverted for the first time in 12 years. What that simply means is that, if you invest in a 2-year bond, you will get a higher rate of return than for a 10-year bond. Insane! The 30-year bond plunged to a record low yield as well.
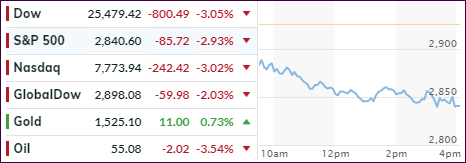
This type of inversion (2/10) has always signaled an upcoming recession, which is why we saw this violent market move today. The damage was widely spread, but the low volatility SPLV softened the blow somewhat (-1.98%) vs. the S&P 500’s -2.93%.
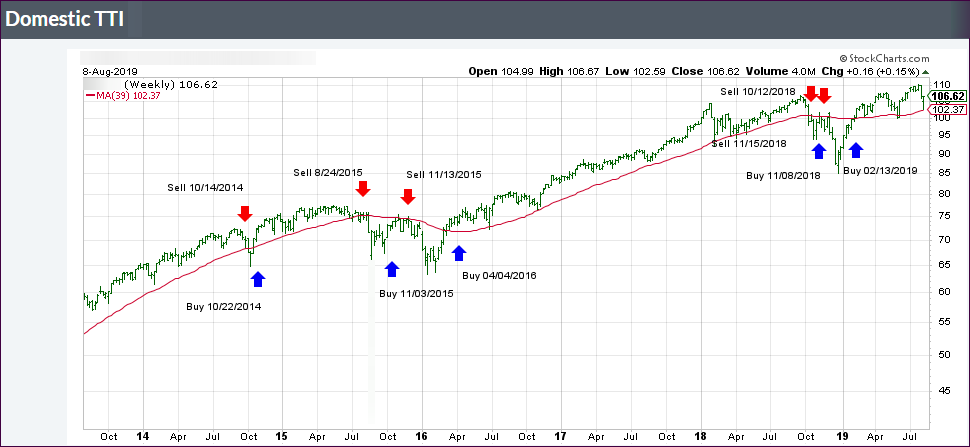
Our Trend Tracking Indexes (TTIs) came under fire as well (see section 3), and the Domestic one has reached a point that is within a hair of generating a ‘Sell’ signal. If this should materialize, we could see more downside damage with the potential of re-visiting the December lows now appearing to be a real possibility.
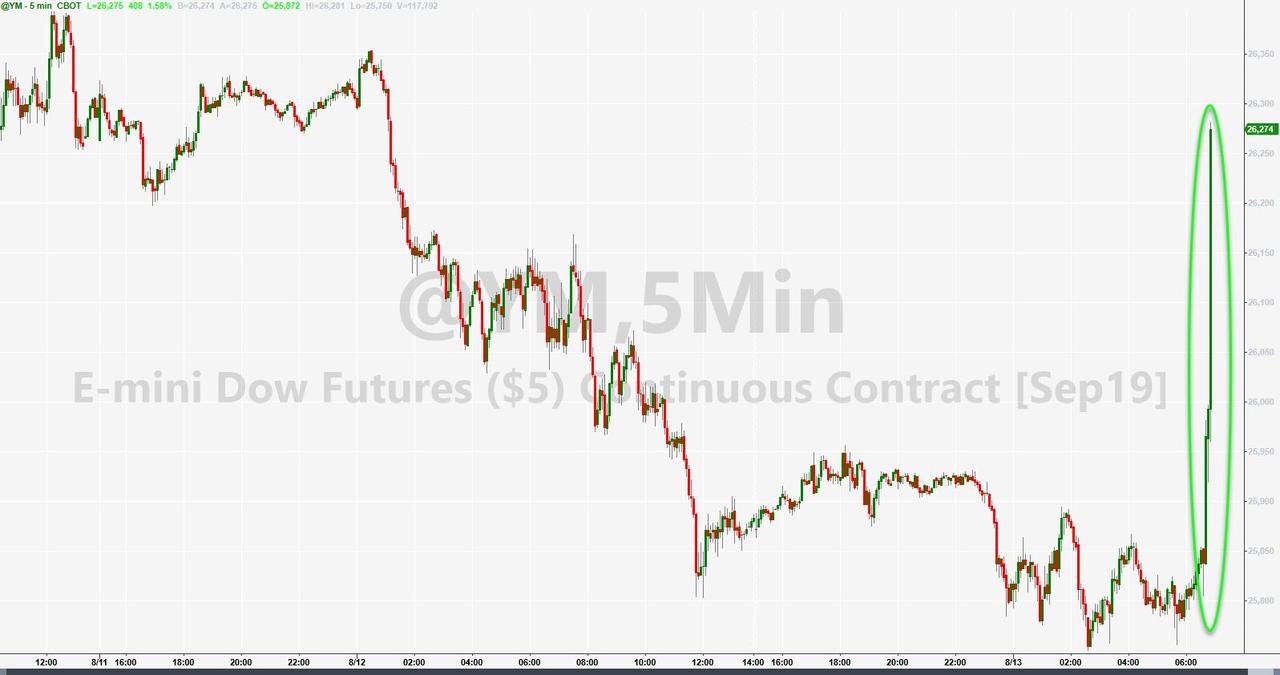
Of course, these days some more bad news could be interpreted as good news by the speed-reading computer algos, and we could be going back the other way.
Read More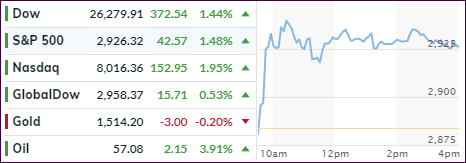