
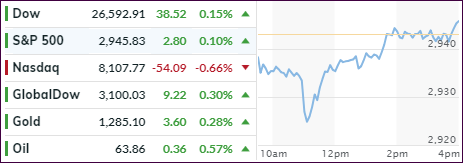
- Moving the markets
A sudden mid-morning drop pulled the major indexes further south, after an already weak opening caused by Google’s poor report card, which showed that revenue growth cooled off in Q1 and all major sales categories performed worse than projected. The punishment was immediate with the stock price being down some 8%.
Not helping the markets was White House Chief of Staff Mulvaney’s comment that the U.S. won’t do a deal with China, unless it’s “great.” The major indexes took it as a negative and south we went.
Not to be outdone, President Trump then reaffirmed his position towards interest rates by demanding the Fed slashes rates by 1%. And that after he called for QE4 and rate cuts earlier this month. Let’s see what happens with the outcome of the FOMC (Federal Open Market Committee), which just started its two-day meeting. We should have an answer by noon tomorrow.
The economy offered a mixed set of numbers. Consumer Confidence spiked and beat expectations. This was offset by a continued slump in home prices nationwide and a crash of the PMI data (manufacturing and services), which was its biggest 2-monthly drop in some five years.
In the end, 2 of the 3 major indexes staged a magic V-shape type of recovery back above the unchanged line, while the Nasdaq lagged and gave back -0.66%, thanks to Google’s disappointing numbers.
Tomorrow’s outcome of the Fed meeting could set market direction for the near future despite seasonal headwinds.
- ETFs in the Spotlight
In case you missed the announcement and description of this section, you can read it here again.
It features 10 broadly diversified and sector ETFs from my HighVolume list as posted every Saturday. Furthermore, they are screened for the lowest MaxDD% number meaning they have been showing better resistance to temporary sell offs than all others over the past year.
The below table simply demonstrates the magnitude with which some of the ETFs are fluctuating regarding their positions above or below their respective individual trend lines (%+/-M/A). A break below, represented by a negative number, shows weakness, while a break above, represented by a positive percentage, shows strength.
For hundreds of ETF choices, be sure to reference Thursday’s StatSheet.
For this current domestic “Buy” cycle, here’s how some our candidates have fared:
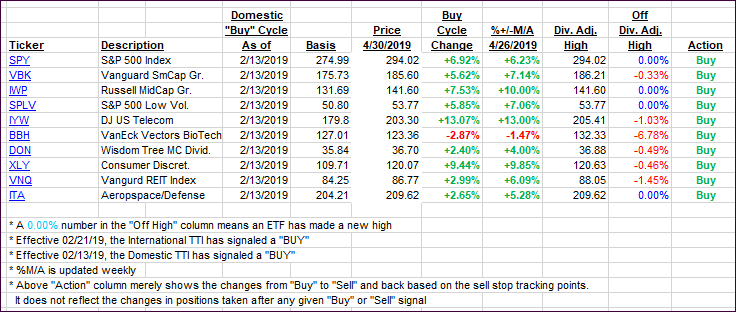
Again, the %+/-M/A column above shows the position of the various ETFs in relation to their respective long-term trend lines, while the trailing sell stops are being tracked in the “Off High” column. The “Action” column will signal a “Sell” once the -8% point has been taken out in the “Off High” column. For more volatile sector ETFs, the trigger point is -10%.
- Trend Tracking Indexes (TTIs)
Our Trend Tracking Indexes (TTIs) advance as a mid-day rebound ensured a green close for 2 of the major indexes.
Here’s how we closed 04/30/2019:
Domestic TTI: +6.79% above its M/A (last close +6.44%)—Buy signal effective 02/13/2019
International TTI: +4.41% above its M/A (last close +4.15%)—Buy signal effective 02/21/2019
Disclosure: I am obliged to inform you that I, as well as my advisory clients, own some of the ETFs listed in the above table. Furthermore, they do not represent a specific investment recommendation for you, they merely show which ETFs from the universe I track are falling within the specified guidelines.
Contact Ulli