Ahead Of The Fed: Markets Limp Along

Ulli Market Commentary Contact

[Chart courtesy of MarketWatch.com]
  1. Moving the markets

While the earnings season continues, traders were more concerned with what the Fed will decide regarding interest rates, when it concludes its two-day meeting on Wednesday. Will they deliver another hoped for sugar high for the economy and the markets, or will the outcome be a dud?

A 0.25% reduction in rates has been baked in the cake, and any disappointment there would have negative consequences for equities. However, even if they meet this low end of expectations, and not reduce by the desired 0.5% whisper number, discontent may spread anyway, and we could witness a sell-off after the recent relentless move higher.

After all, eventually, investors and trades will wake up to the fact that lower rates are a sign of declining economic activity and not an indication that all is well. Rising rates represent an economy firing on all cylinders, a condition that therefore needs to be reigned in due to the possibility of inflation getting out of hand.

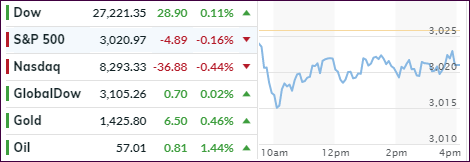
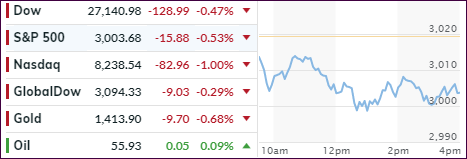
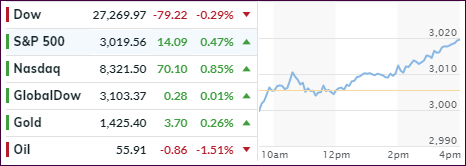
We will find out in a couple of days what the reaction will be and if traders will sell the Fed news. In the meantime, the markets will likely limp along directionless, as they did today.  

Read More

ETFs On The Cutline – Updated Through 07/26/2019

Ulli ETFs on the Cutline Contact

Below, please find the latest High-Volume ETF Cutline report, which shows how far above or below their respective long-term trend lines (39-week SMA) my currently tracked ETFs are positioned.

This report covers the HV ETF Master List from Thursday’s StatSheet and includes 322 High Volume ETFs, defined as those with an average daily volume of more than $5 million, of which currently 272 (last week 272) are hovering in bullish territory. The yellow line separates those ETFs that are positioned above their trend line (%M/A) from those that have dropped below it.

Take a look:                                                                   

The HV ETF Master Cutline Report

In case you are not familiar with some of the terminology used in the reports, please read the Glossary of Terms. If you missed the original post about the Cutline approach, you can read it here.      

ETF Tracker Newsletter For July 26, 2019

Ulli ETF Tracker Contact

ETF Tracker StatSheet          

You can view the latest version here.

GDP SLOWS BUT BEATS EXPECTATIONS

[Chart courtesy of MarketWatch.com]
  1. Moving the markets

All eyes were on the latest release of the second quarter GDP report, and it did not disappoint. While we saw a slowdown from the torrid pace of 3.1% per annum set in the first quarter, the 1.9% expectation was easily beat with the economy growing at 2.1% per annum in the second quarter. The fly in the ointment was that corporate profits dumped to an 8-year low.

While this number is sure to be revised again, for right now, the computer algos saw ‘good’ news as ‘good’ news, and the major indexes rose to new intra-day record highs with the Dow being the laggard again.

This better-than-expected GDP number is sure to give the Fed some headache when it comes to next week’s decision as to whether to lower rates, and if so by how much, or stay put. After all, they see inflation data as mild, which leaves them with the question “are we really seeing a slowdown that justifies further easing?

The Nasdaq led all the way by gaining +1.11% followed by the S&P 500 with +0.74%. More than 40% of the S&P 500 companies have now reported quarterly earnings, so the earnings race will continue next week.

Quipped ZH regarding the Fed: Let’s hope that Powell delivers, because global liquidity is starting to diverge again.  This chart makes that abundantly clear, while bonds and stocks continue with their own interpretation of divergence.

The Fed will be on deck next Wednesday, and I for one am curious whether the adage “buy the rumor, sell the fact” rears its ugly head again, especially if the Fed indeed turns out to be in an interest rate cutting mode.

Read More

Weekly StatSheet For The ETF Tracker Newsletter – Updated Through 07/25/2019

Ulli ETF StatSheet Contact

ETF Data updated through Thursday, July 25, 2019

Methodology/Use of this StatSheet:

1. From the universe of over 1,800 ETFs, I have selected only those with a trading volume of over $5 million per day (HV ETFs), so that liquidity and a small bid/ask spread are assured.

2. Trend Tracking Indexes (TTIs)

Buy or Sell decisions for Domestic and International ETFs (section 1 and 2), are made based on the respective TTI and its position either above or below its long-term M/A (Moving Average). A crossing of the trend line from below accompanied by some staying power above constitutes a “Buy” signal. Conversely, a clear break below the line constitutes a “Sell” signal. Additionally, I use a 7.5% trailing stop loss on all positions in these categories to control downside risk.

3. All other investment arenas do not have a TTI and should be traded based on  the position of the individual ETF relative to its own respective trend line (%M/A). That’s why those signals are referred to as a “Selective Buy.” In other words, if an ETF crosses its own trendline to the upside, a “Buy” signal is generated. Since these areas tend to be more volatile, I recommend a wider trailing sell stop of 7.5% -10% depending on your risk tolerance.

If you are unfamiliar with some of the terminology, please see Glossary of Terms and new subscriber information in section 9.     

1. DOMESTIC EQUITY ETFs: BUY — since 02/13/2019

Click on chart to enlarge

Our main directional indicator, the Domestic Trend Tracking Index (TTI-green line in the above chart) is now positioned above its long-term trend line (red) by +7.68% after having generated a new Domestic “Buy” signal effective 2/13/19 as posted.

Read More

Scrambling Below The Unchanged Line

Ulli Market Commentary Contact

[Chart courtesy of MarketWatch.com]
  1. Moving the markets

There was not much upward momentum to be found in the equities markets, as Europe set the negative tone early on with all indicators sliding into the red. The major indexes followed suit and never came close to breaking above their respective unchanged lines.

The retreat came in the face of a busy earnings day, which featured mainly disappointments, which weighed heavy on sentiment despite prospective interest rate cuts from the ECB.

The Nasdaq was hardest hit after Tesla (-15%) failed to meet expectations, which dragged tech-related stocks down with it. Others that did not fare well included Facebook, Boeing and Ford.  

Even those companies that reported better than expected earnings seem to be affecting traders’ mood negatively, as they are hesitant to raise guidance and are lowering second half estimates due to the disruption experienced by current trade policies.

Bond yields rose today with the 10-year gaining some 2.7 basis points to close at 2.08%. If that sounds ridiculously low to you, take a look at the other side of the Atlantic where the German 10-year bond now has crashed to record lows to -0.41% before rebounding into the close.

At its lowest point, it means you can expect to lose -0.41% every year for 10 years on your investment, when at least in the U.S. you will earn +2.08% per annum. If you think this is simply nuts, you are correct. It’s nothing but financial engineering at its finest.

Read More

Edging Higher On Mixed Earnings

Ulli Market Commentary Contact

[Chart courtesy of MarketWatch.com]
  1. Moving the markets

Aimless meandering best describes today’s early part of the session, during which the major indexes, except for the Dow, hovered around their respective unchanged lines. A sudden mid-day pump not only pushed the two indexes into the green but also to a new record close. The Dow was weighed down, as poor profit reports by component members Caterpillar and Boeing kept the index in the red all day long.

The Nasdaq held up surprisingly well, despite the Justice Department launching a broad anti-trust investigation into the big tech companies (FANG names). Depending on the extent, this action could eventually cause this rally to stagger.

On the economic front, we learned that New Home Sales missed expectations (646k vs. 658k) despite a collapse in mortgage rates, which did not bring back an onslaught of buyers. Adding insult to injury, the purchases for March, April and May were all revised lower. However, YoY new-home sales rebounded.

Manufacturing hit the skids again, not just here in the U.S. but also in Europe and Japan, while the domestic service sector beat expectations. As one analyst pointed out, this simply means “we have a two-speed economy with a steady service sector growth masking a deepening downturn in the manufacturing sector.”

I see two conflicts righty now affecting the markets. One, central banks are about to embark on more easing, yet on the other hand, the slowdown of growth on a global scale, along with some geopolitical factors, is weighing on traders’ minds. Can more central bank intervention really extend this already overextended business cycle?

I guess we’ll have to wait and find out.

Read More