Optimism Reigns

Ulli Market Commentary Contact

[Chart courtesy of MarketWatch.com]

  1. Moving the markets

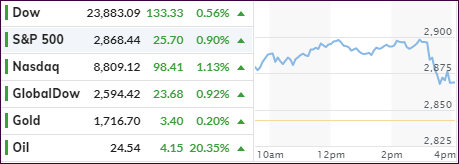
An early rally got cut in half by the end of the session, when Fed Vice chairman Clarida opined that more support for the economy was needed, but he expects a rebound by next quarter, despite the current massive drop in unemployment and GDP.

He noted:

“More policy support will be needed from the Fed and possibly also fiscal policy. It just depends on how this evolves.”

“Realistically, it’s going to take some time for the labor market to recover from this shock. I do think the recovery can commence in the second half of the year.”

“The Fed will employ “forceful, proactive, and aggressive” policies “until we’re comfortable the economy is on the road to recovery, especially for Main Street. We can’t minimize that we are in a recession here.”

This was not what markets had expected, especially not the “R” word, so south we went, but the major indexes still managed to come out with some decent gains.

The fact that the markets are too optimistic was brought home by Nomura’s managing director, Charlie McElligott:

“Summer could bring hard economic data collapsing like we’ve never seen before, terrible corporate guidance, stories of pending bankruptcies, and a second wave of layoffs that will hit the white-collar sector. Rising trade-war rhetoric from the White House as a presidential election campaign heats up could present more risk.”

“That’s why I think folks are getting ready to hit the wall again, with this idea we’ve moved out of stabilization and now we’re back into the harsh reality of what this is, without having a Federal Reserve boost and no more stimulus checks until things get a lot worse.”

“The good news? The September to December period could look more constructive for equities, though much depends on if we get hit by a second wave of the virus.”

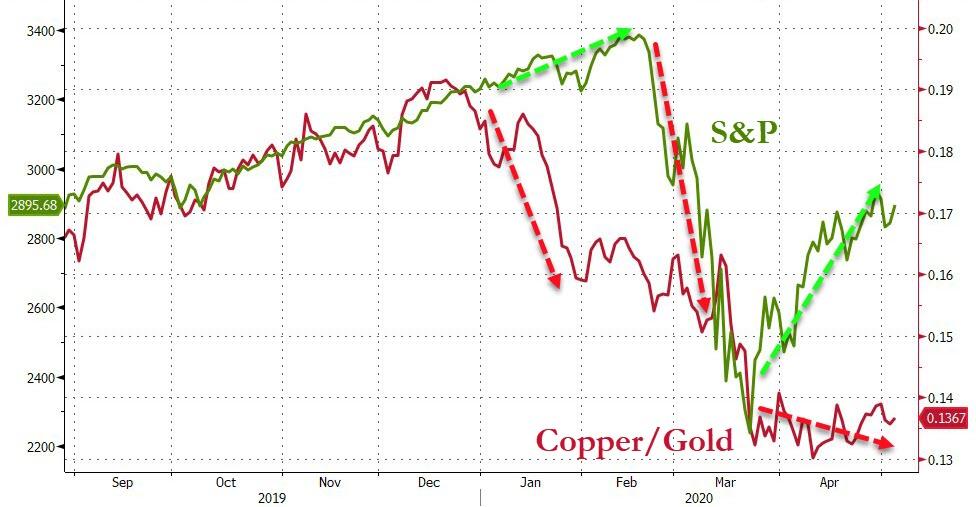
Nobody knows what’s next, but if Bloomberg’s chart is correct, the disconnect will continue until the S&P 500 snaps back down to the Copper/Gold ratio, the direction of which was spot on earlier this year.

Read More
Trying To Find Some Footing

Ulli Market Commentary Contact

[Chart courtesy of MarketWatch.com]

  1. Moving the markets

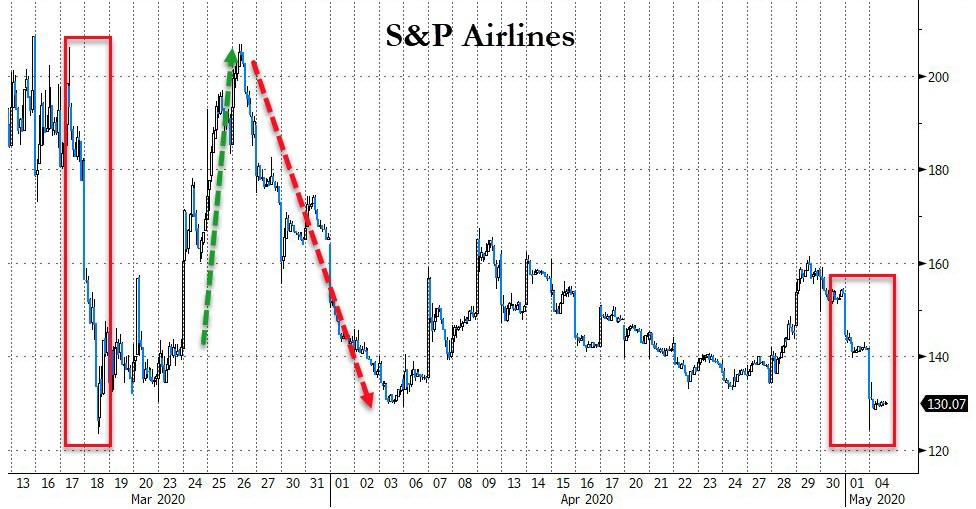
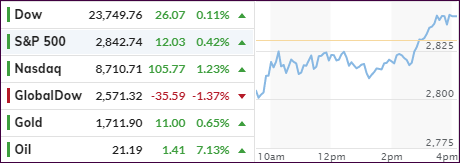
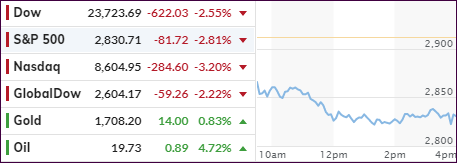
After a couple of down days in the equity markets, a bounce-back was in order, although the conditions were not favorable. Sunday’s news that Warren Buffett had sold all his airline stocks took a toll on the futures markets, which subsequently translated into a weak opening.

The major indexes spent most of the session bobbing and weaving in the red except for the Nasdaq, which showed more staying power and ended up closing solidly in the green.

But, as we’ve seen many times in the past, a magic afternoon levitation pumped the weaker indexes to a green close, despite US Manufacturers New Orders crashing by the most ever. But as we have learned, underlying fundamentals do not matter, until one day they do.

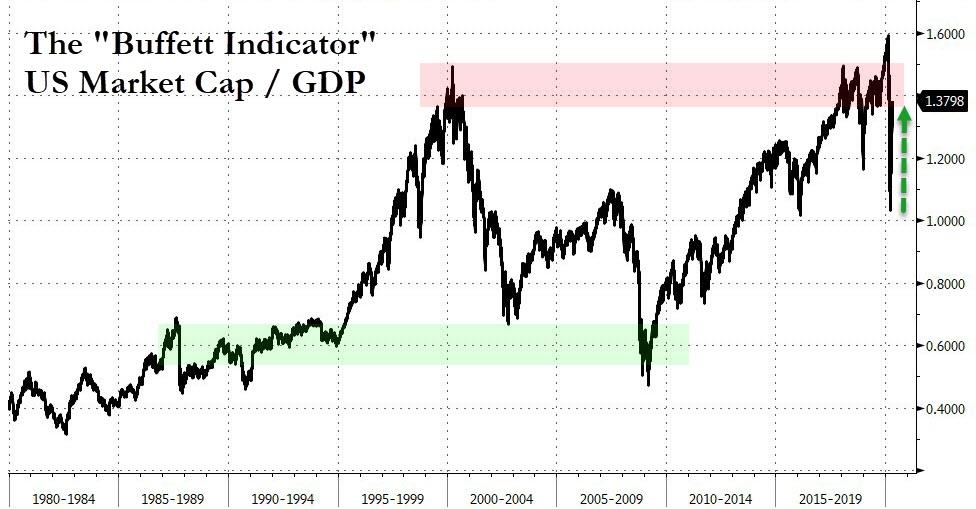
Yet rising U.S.-China tensions with the Covid-19 blame game going on full force, along with new threats of tariffs, could not stop the afternoon ramp. And that despite Buffett’s many warnings, including his widely publicized indicator, US Market Cap/GDP, which Bloomberg presents in this chart. It clearly shows his indicator being in the danger zone.

Some good news bad news headlines, with the bad ones outscoring the only good one, did nothing to slows the market ascent. As ZH commented:

Good news…

Coronavirus Defeated By Experimental Antibody That Targets Spike Protein

But…

American Power Grid ‘Vulnerable’ To Chinese Cyberattacks, Navarro Warns

Q1 GDP To Be Revised Drastically Lower To -8%

NYT Publishes Grim CDC Projections Calling For Daily Coronavirus Deaths To Double By June

In the end, the indexes were trying to find some support, which they surely need ahead of some of the big econ announcements later this week like Jobless Claims and Unemployment rate.

Read More

ETFs On The Cutline – Updated Through 05/01/2020

Ulli ETFs on the Cutline Contact

Below, please find the latest High-Volume ETF Cutline report, which shows how far above or below their respective long-term trend lines (39-week SMA) my currently tracked ETFs are positioned.

This report covers the HV ETF Master List from Thursday’s StatSheet and includes 322 High Volume ETFs, defined as those with an average daily volume of more than $5 million, of which currently 60 (last week 66) are hovering in bullish territory. The yellow line separates those ETFs that are positioned above their trend line (%M/A) from those that have dropped below it.

Take a look:                                                                   

The HV ETF Master Cutline Report

In case you are not familiar with some of the terminology used in the reports, please read the Glossary of Terms. If you missed the original post about the Cutline approach, you can read it here.      

ETF Tracker Newsletter For May 1, 2020

Ulli ETF Tracker Contact

ETF Tracker StatSheet          

You can view the latest version here.

STARTING MAY ON A SOUR NOTE

[Chart courtesy of MarketWatch.com]

  1. Moving the markets

Some reality struck the markets today, as big tech earnings disappointed and Trump threatened to pick up the tariff war with China again, supposedly for its poor handling on the Covid-19 pandemic.

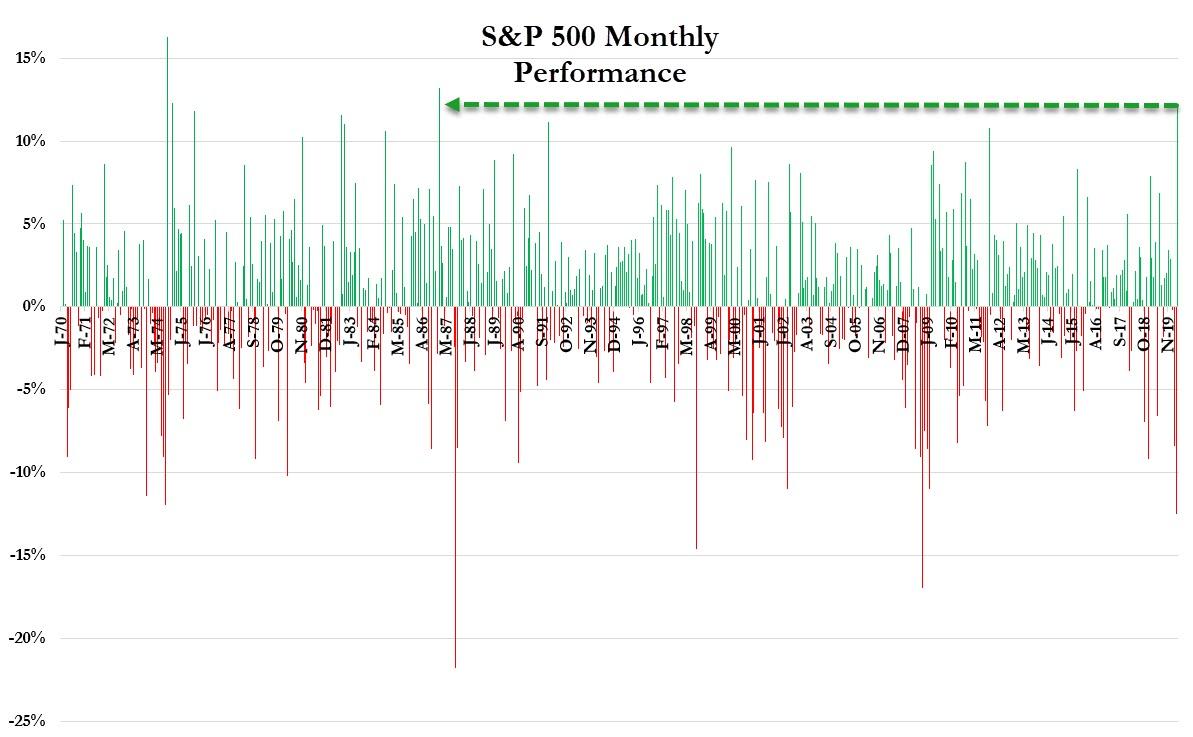
While MSM is still buzzed about last months Fed assisted rebound in equities, keep in mind that the S&P 500’s April +12.6% gain was preceded by a loss of -12.5% in March with those two months ending in a draw. Coincidence? Be that as it may, the markets need to gain another 7.2% to get to the level we sold at on 2/27/20.

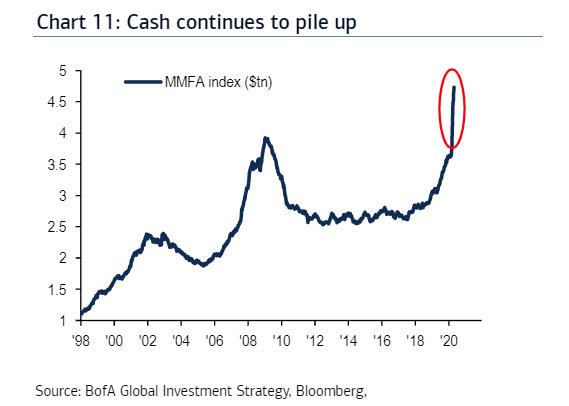
As ZH reported, it’s interesting to note that while algos and quants were busy buying equities hand over fist, human and hedge fund investors continue to sell, as the assets held in money market accounts spiked.

Added BofA’s Hartnett:

“BofA’s private clients have reverted to equity ‘sellers into strength’ in the past 3 weeks…indeed past 2 years in 49 of 69 weeks S&P 500 has exceeded 2800 level private clients have been sellers.”

He further noted:

“Wall St always undershoots and overshoots…most plausible reason overshoot continues is that US policy makers have stimulated more in 10 past weeks than Japan has in 30 years and US real estate/banking/consumer data turns out not to be Japanese.”

And leave it to technical analyst Sven Henrich to lay out the details:

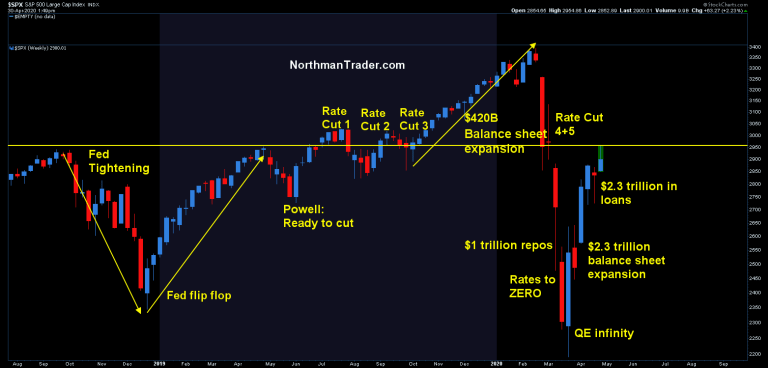
“The market is a follow the Fed machine long trained to jump back into equities at any sign of Fed action jawboning and promises. It’s no accident that “don’t fight the Fed” is popular mantra. It’s the very proof that market participants know that the Fed is in effect targeting asset prices. Just look at the past year and a half in this chart.”

Not helping the sour mood on Wall Street was a US Manufacturing Survey showing a record collapse in output, Orders and Jobs.

We are now seeking the biggest two-day drop since the March collapse, and the early weekly gain has now evaporated. Does that mean we are on track validating the adage “sell in May and go away?”

It’s a bit early for that but come next week, all trading rooms around the world will be fully staffed again after today’s Mayday Holiday, and we’ll find out whether the bulls can regain the lost momentum of the past couple of days.

Read More

Weekly StatSheet For The ETF Tracker Newsletter – Updated Through 04/30/2020

Ulli ETF StatSheet Contact

ETF Data updated through Thursday, April 30, 2020

Methodology/Use of this StatSheet:

1. From the universe of over 1,800 ETFs, I have selected only those with a trading volume of over $5 million per day (HV ETFs), so that liquidity and a small bid/ask spread are assured.

2. Trend Tracking Indexes (TTIs)

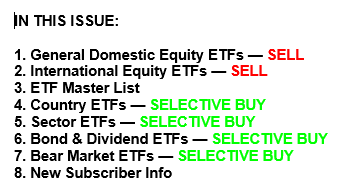
Buy or Sell decisions for Domestic and International ETFs (section 1 and 2), are made based on the respective TTI and its position either above or below its long-term M/A (Moving Average). A crossing of the trend line from below accompanied by some staying power above constitutes a “Buy” signal. Conversely, a clear break below the line constitutes a “Sell” signal. Additionally, I use a 7.5% trailing stop loss on all positions in these categories to control downside risk.

3. All other investment arenas do not have a TTI and should be traded based on  the position of the individual ETF relative to its own respective trend line (%M/A). That’s why those signals are referred to as a “Selective Buy.” In other words, if an ETF crosses its own trendline to the upside, a “Buy” signal is generated. Since these areas tend to be more volatile, I recommend a wider trailing sell stop of 7.5% -10% depending on your risk tolerance.

If you are unfamiliar with some of the terminology, please see Glossary of Terms and new subscriber information in section 9.     

1. DOMESTIC EQUITY ETFs: SELL — since 02/27/2020

Click on chart to enlarge

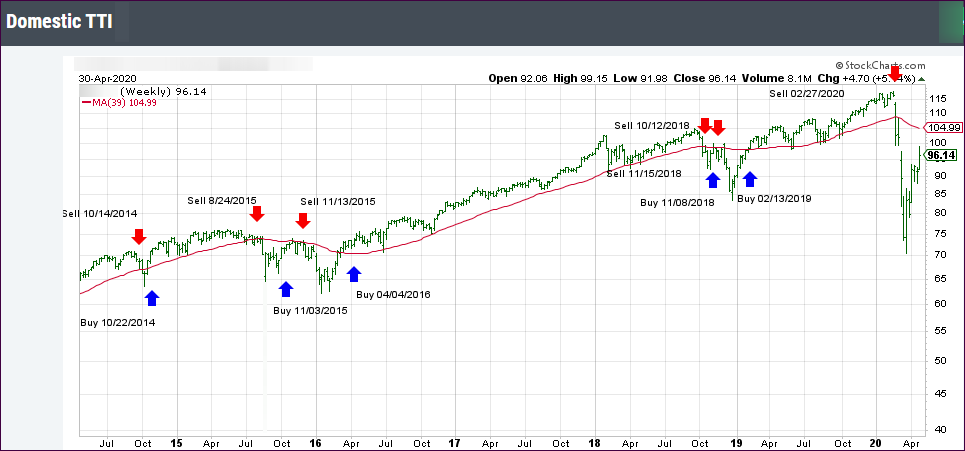
Our main directional indicator, the Domestic Trend Tracking Index (TTI-green line in the above chart) is now positioned below its long-term trend line (red) by -8.61% after having generated a new Domestic “Sell” signal effective 2/27/20 as posted.

Read More

Closing A Strong April With A Whimper

Ulli Market Commentary Contact

[Chart courtesy of MarketWatch.com]

  1. Moving the markets

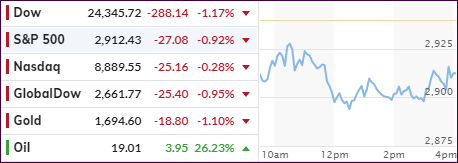
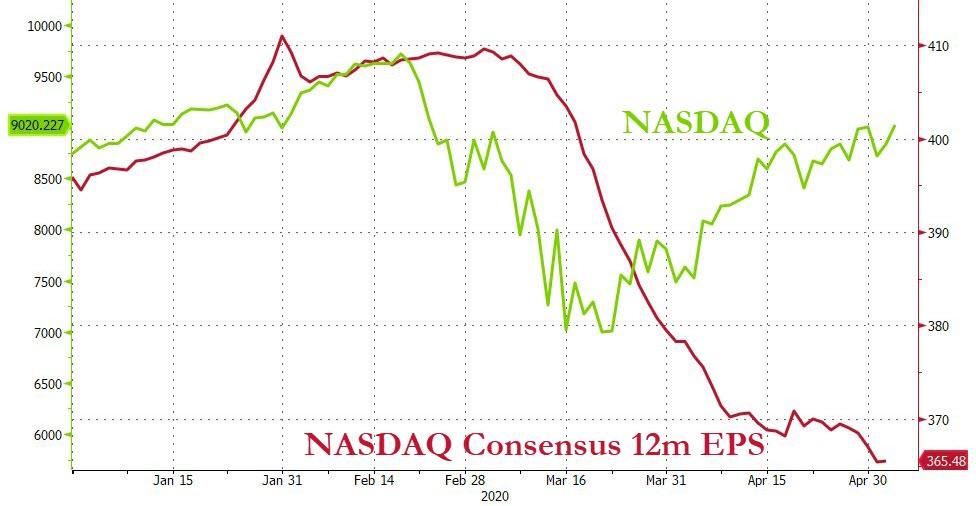
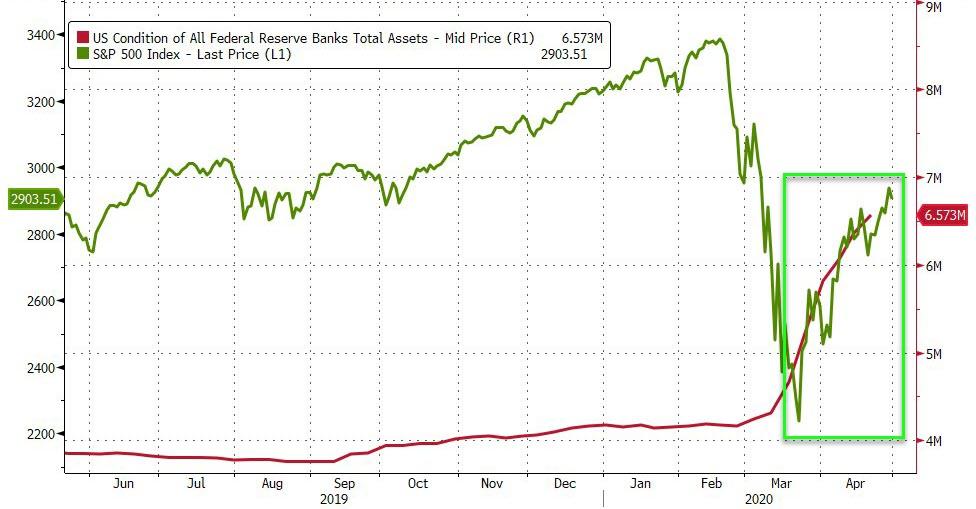
After rallying all month, the major indexes stalled today, but were able to wipe out most of March’s losses for the buy-and-hold crowd with the S&P 500 sporting its best monthly return since 1987. Of course, as we know, the rebound was entirely based on Fed support, as the markets were swamped with liquidity. As a buy-and-holder, you should give thanks to the Fed’s largesse; next time you may not be as fortunate.

Analyst Marc Lasry confirmed in a CNBC interview what I have been saying for a long time:

“None of this [equity rally] is based on fundamentals, this is all about what the Fed is doing… and sooner or later reality will reassert itself.”

Joining in the chorus of reality was economist Jim Bianco:

“I understand the market has been up a lot since the March low. But what I see in the market is a retracement rally that looks very similar to the first type of rallies that you get in protracted bear markets.”

After which he added:

“We’ll revisit the 2,200 S&P low, if not make a lower low – probably by late summer.”

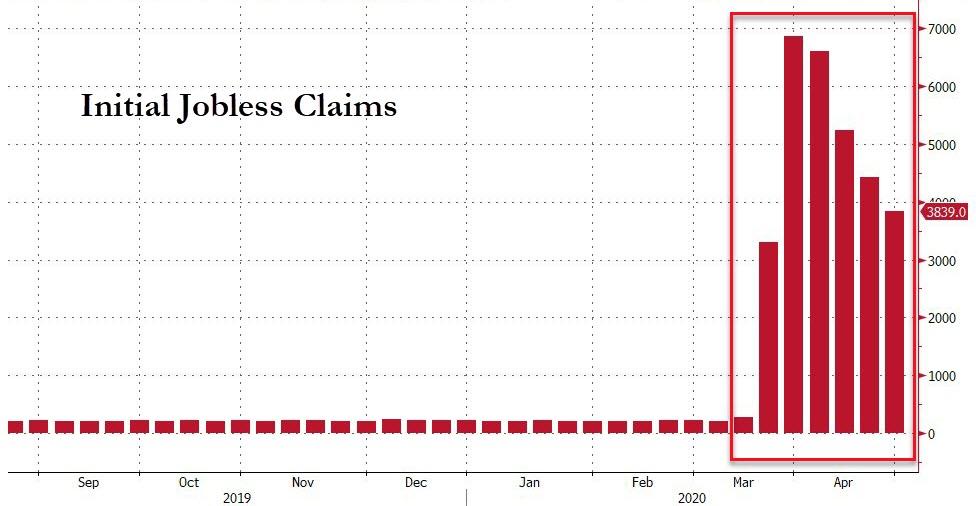
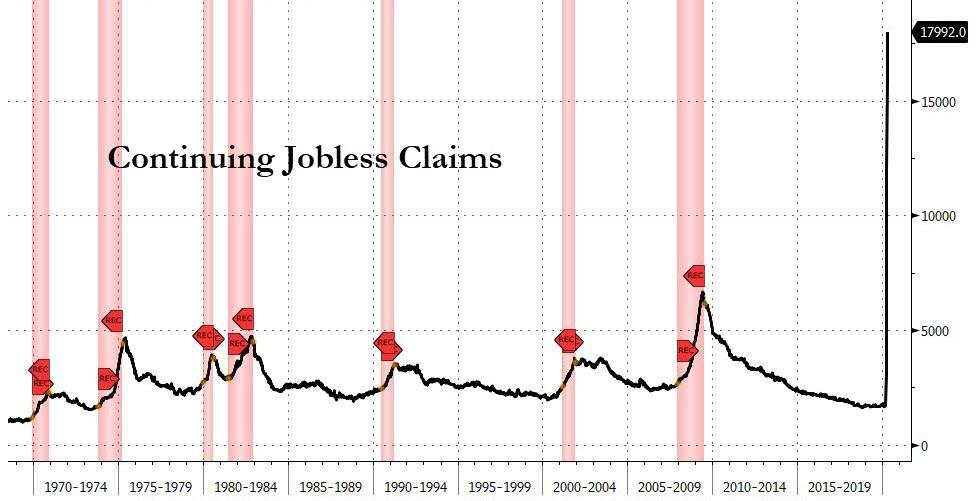
The economic conditions continue to worsen, as another 3.839 million Americans have field for unemployment benefits for the first time bringing the six-week total to 30.31 million which, according to ZeroHedge, is over 12 times the prior worst five-week period in the last 50-plus years. And, of course, the continuing claims are shooting up as well.

Consumer spending followed suit, as its spending collapsed by a record -7.3%, its sharpest drop since the first quarter of 1980. On the positive side, the savings rate exploded from 8% to 13.1% of disposable income, indicating, that consumers are starting to “live within their means.”

In the end, the mission was accomplished leaving me pondering if the adage “sell in May and go away,” still holds true, or will this time really be different?

Read More