
- Moving the markets
No matter what the news headlines say about the coronavirus, investors seem to look past it and find another area to focus on. That was the case today, with potential disruptions to global economies being pushed on the back burner, while positive earnings moved back to the front.
Earnings numbers overall have been relatively strong and have come in slightly better than expected, while forward guidance has so far not presented any sudden negative surprises.
Of course, expectations for the Fed to do whatever is necessary to prop up the economy by maintaining loose financial conditions, has been the backbone supporting equities.
Still, the coronavirus and its global impact will remain on top of the list, despite the Fed’s liquidity support to boost stock valuations. After all, a prolonged disturbance of the global supply chain will have dire consequences on market direction, no matter how “accommodative” the Fed is willing to be.
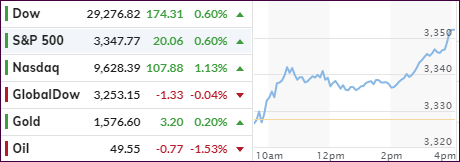
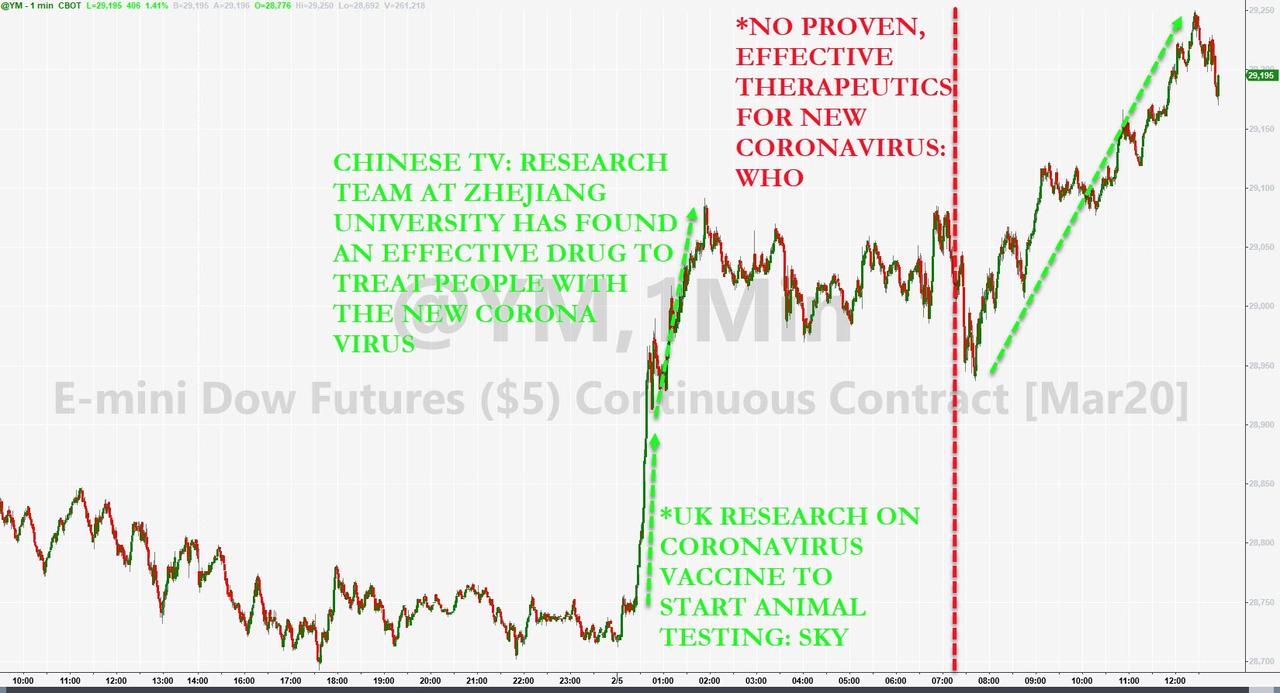
In the meantime, we saw another rally into record high territory by the S&P 500 and the Nasdaq, and that despite these facts, according to ZH: “More quarantines, more cases, more deaths and more uncertainty about whether any production is back online.”
Go figure…
Read More

