Breakout: S&P 500 And Nasdaq Score Record Highs

Ulli Market Commentary Contact

[Chart courtesy of MarketWatch.com]

  1. Moving the markets

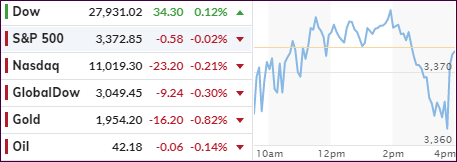
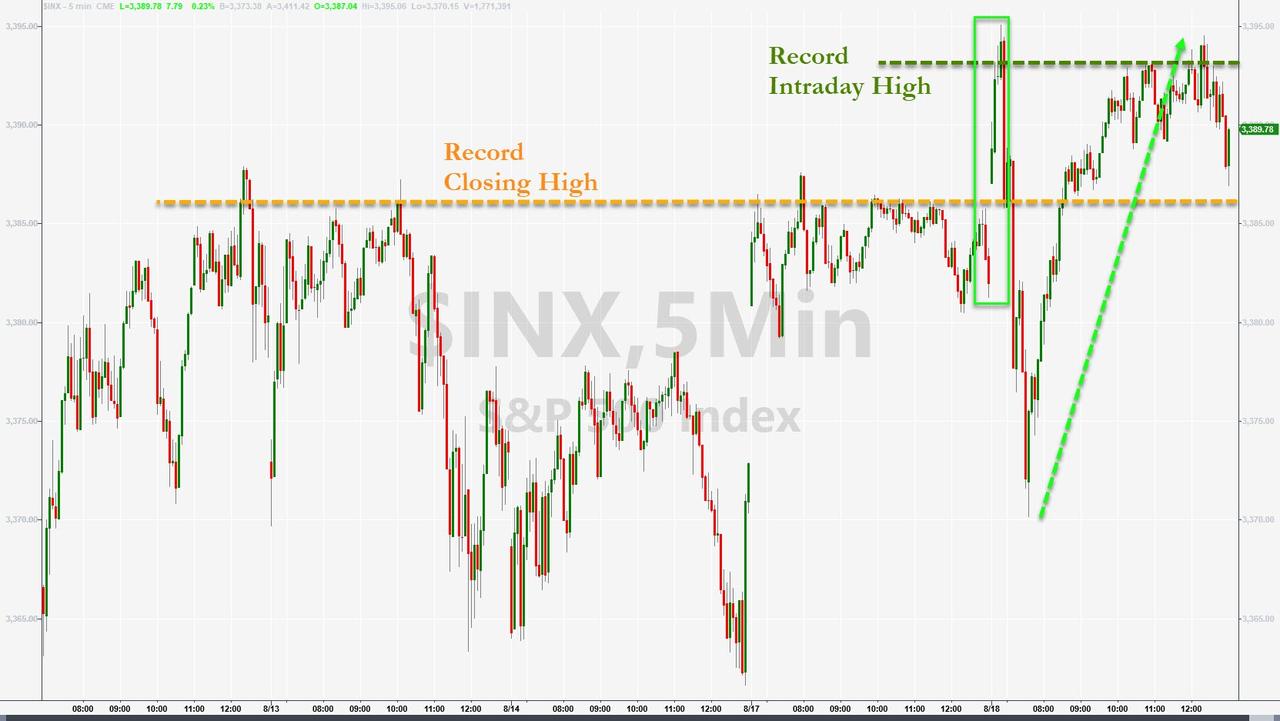
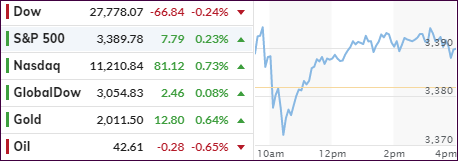
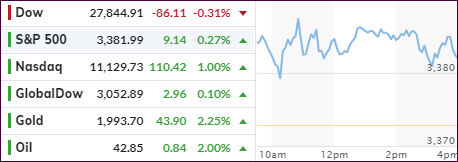
We saw a sloppy start to the session, during which the S&P 500 bounced, dropped into the red but recovered and slowly but surely climbed out of that early hole. Despite several attempts during the recent past, today was the day the index managed to set a new all-time high. Not to be outdone, the Nasdaq joined the party, but the Dow was the laggard by closing below its unchanged line.

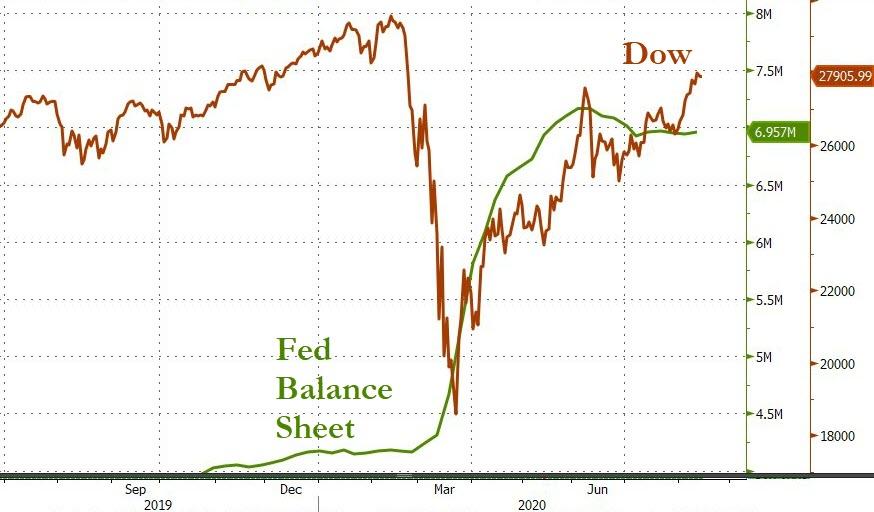
Sure, you can read all of the accolades about this marking the fastest recovery in history, but the main reason has not been an economic recovery but merely the reckless acceleration of money printing by the Fed, which is represented in this chart by Bloomberg:

Notice how the S&P 500 has perfectly synced up with the acceleration of liquidity ever since the March meltdown. Yes, you can safely conclude that any slowdown or reduction of monetary “activity” will cause this market to crumble. That means Fed policy is committed to maintain this trend unless Fed head Powell wants to upset the applecart.

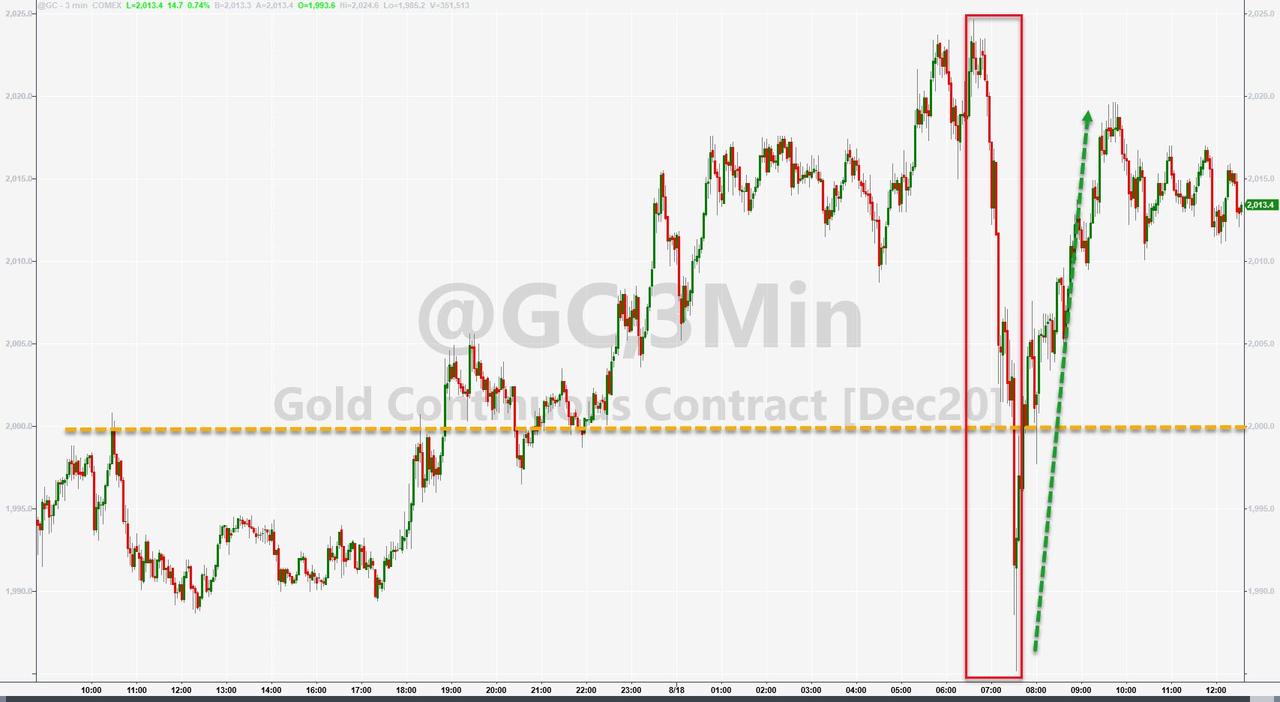
Gold managed to not only reclaim its $2k level but also close above it. It wasn’t easy, as an early rally got slammed until buyers stepped in and recouped the early losses.  

The Nasdaq took top billing with a +0.73% gain, but it remains to be seen if that torrid momentum can be sustained. It would not be surprise so see some pullback from these lofty levels.

Lending market support late in the day was news that the Dems are reducing their stimulus demands by almost 50%, which makes me believe that a compromise deal may be forthcoming soon.

Read More
Gold Pops—US Dollar Drops

Ulli Market Commentary Contact

[Chart courtesy of MarketWatch.com]

  1. Moving the markets

I could not help but laugh out loud last Friday afternoon when one of the greatest gold haters, namely Warren Buffett, disclosed in his Berkshire Hathaway’s latest 13F filing that he liquidated huge amounts of US Bank stocks, and replaced them as follows:

Berkshire took a new stake (20.9 million shares) in Barrick Gold, a holding that was valued at about $564 million at the end of that period.

Say what? After mocking those who believe in the soundness of gold for decades, he appeared to have flipped, which to me means that he is clearly seeing what reckless money printing will eventually do to the purchasing power of a currency.

“(Gold) gets dug out of the ground in Africa, or someplace. Then we melt it down, dig another hole, bury it again and pay people to stand around guarding it. It has no utility. Anyone watching from Mars would be scratching their head.”

Warren Buffett in 1998.

I find it amusing that he is finally seeing the light, and his purchase lit the fire under gold during this session, as the precious metal managed to almost reclaim its recently lost $2,000 level. Still, a gain of +2.19% make this a satisfying day.

The Nasdaq set a new intraday record, came off its high but still closed the session with a solid 1% gain, thereby outperforming the S&P (+0.27%) and the Dow (-0.31%), but lagging when compared to Gold’s superior feat. Gold’s move was helped by a drop in the US dollar, which touched its late July lows.

The S&P 500 remains stuck within 1% of its all-time high from February and clearly needs a new driver to propel it past that level, which it has now touched several times.

Quipped ZeroHedge tongue in cheek:

Tick-tock, time’s up for the dead-cat bounce…

Read More

ETFs On The Cutline – Updated Through 08/14/2020

Ulli ETFs on the Cutline Contact

Below, please find the latest High-Volume ETF Cutline report, which shows how far above or below their respective long-term trend lines (39-week SMA) my currently tracked ETFs are positioned.

This report covers the HV ETF Master List from Thursday’s StatSheet and includes 312 High Volume ETFs, defined as those with an average daily volume of more than $5 million, of which currently 235 (last week 227) are hovering in bullish territory. The yellow line separates those ETFs that are positioned above their trend line (%M/A) from those that have dropped below it.

Take a look:                                                                   

The HV ETF Master Cutline Report

In case you are not familiar with some of the terminology used in the reports, please read the Glossary of Terms. If you missed the original post about the Cutline approach, you can read it here.      

ETF Tracker Newsletter For August 14, 2020

Ulli ETF Tracker Contact

ETF Tracker StatSheet          

You can view the latest version here.

WAVERING INTO THE WEEKEND

[Chart courtesy of MarketWatch.com]

  1. Moving the markets

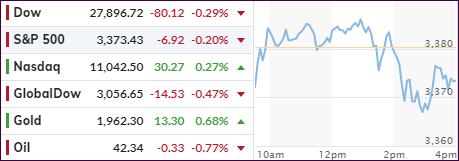
Bobbing and weaving best describes today’s market action with the major indexes clinging to their respective unchanged lines. Bulls were not in a buying mood with news about economic data lacking spunk, as did the stalled negotiations about extending the coronavirus aid.

Weaker-than-expected retail sales pulled the all-important question about the economic rebound back on the front burner, but it’s all a guessing game at this point. I believe any thoughts of a V-shape recovery is merely wishful thinking and not based on reality.

The data “underscores that wary consumers have turned more cautious amid a virus resurgence and fading stimulus support,” said Lydia Boussour, senior economist at Oxford Economics. She said the data also matches up with a stall in the firm’s own recovery tracker, confirming that “consumers are likely to keep a tight rein on their spending until a medical solution to the pandemic is found.”

(source: Marketwatch)

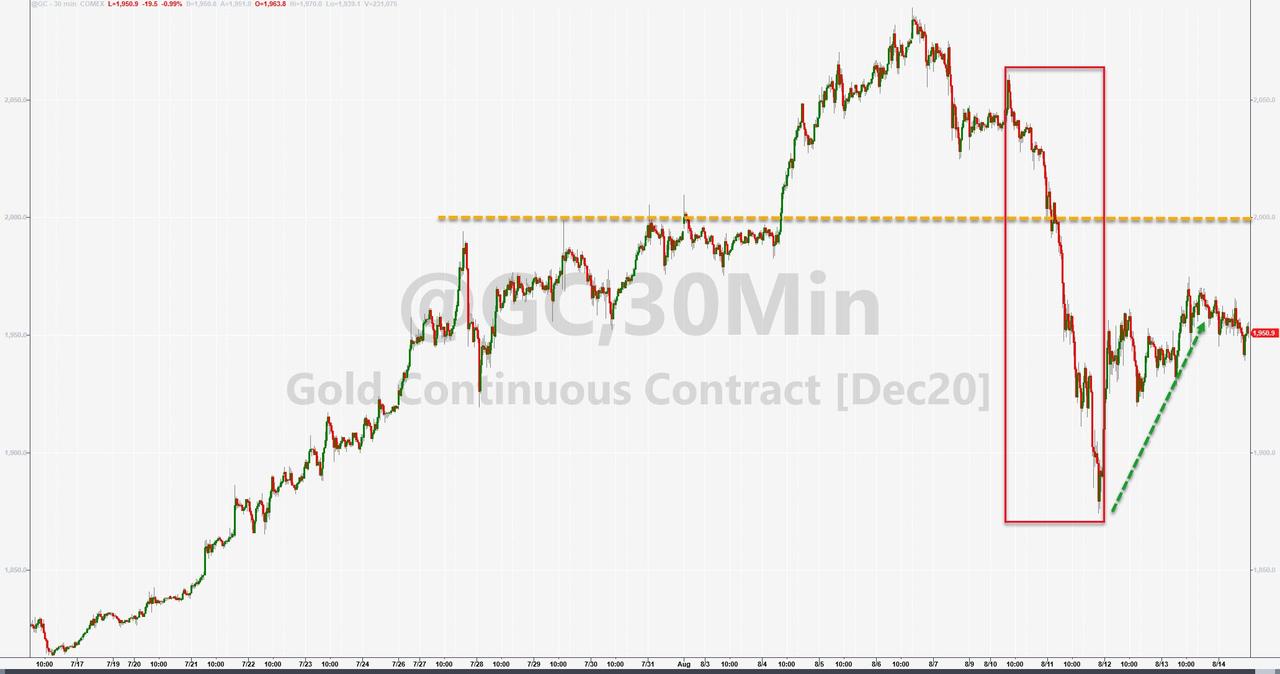
For the week, the S&P 500 eked out a meager +0.66%, while gold was not able to recoup all of its losses sustained early in the week. The precious metal ended down -4.5% breaking a nine-week winning streak.  

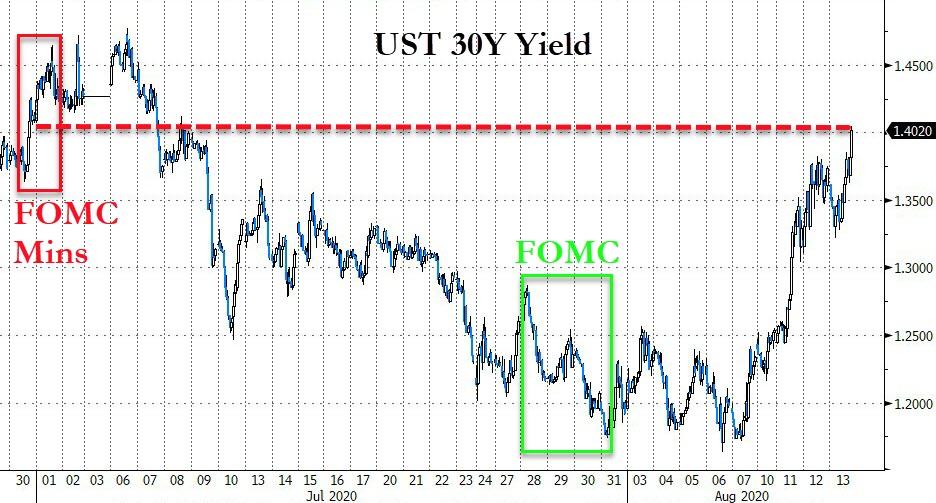
The same fate happened to bonds with Treasury yields spiking 19 basis points (30-year) this week sending prices reeling. Weakness continued in the US dollar as well, which experienced its sixth drop in the last seven weeks, according to ZH.

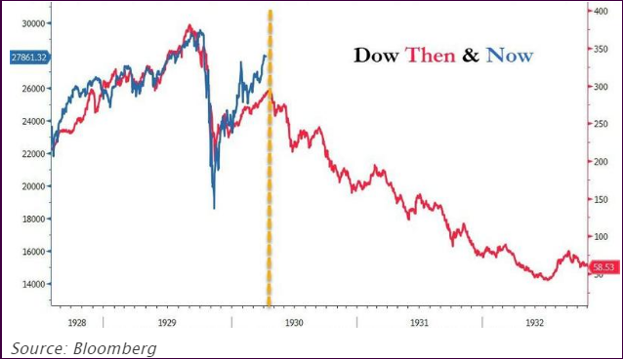
In the end, all future equity moves higher depend predominantly on the Fed’s balance sheet continuing to expand, as Bloomberg demonstrates in this chart.

Read More

Weekly StatSheet For The ETF Tracker Newsletter – Updated Through 08/13/2020

Ulli ETF StatSheet Contact

ETF Data updated through Thursday, August 13, 2020

Methodology/Use of this StatSheet:

1. From the universe of over 1,800 ETFs, I have selected only those with a trading volume of over $5 million per day (HV ETFs), so that liquidity and a small bid/ask spread are assured.

2. Trend Tracking Indexes (TTIs)

Buy or Sell decisions for Domestic and International ETFs (section 1 and 2), are made based on the respective TTI and its position either above or below its long-term M/A (Moving Average). A crossing of the trend line from below accompanied by some staying power above constitutes a “Buy” signal. Conversely, a clear break below the line constitutes a “Sell” signal. Additionally, I use a 7.5% trailing stop loss on all positions in these categories to control downside risk.

3. All other investment arenas do not have a TTI and should be traded based on  the position of the individual ETF relative to its own respective trend line (%M/A). That’s why those signals are referred to as a “Selective Buy.” In other words, if an ETF crosses its own trendline to the upside, a “Buy” signal is generated. Since these areas tend to be more volatile, I recommend a wider trailing sell stop of 7.5% -10% depending on your risk tolerance.

If you are unfamiliar with some of the terminology, please see Glossary of Terms and new subscriber information in section 9.     

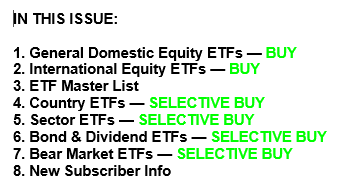
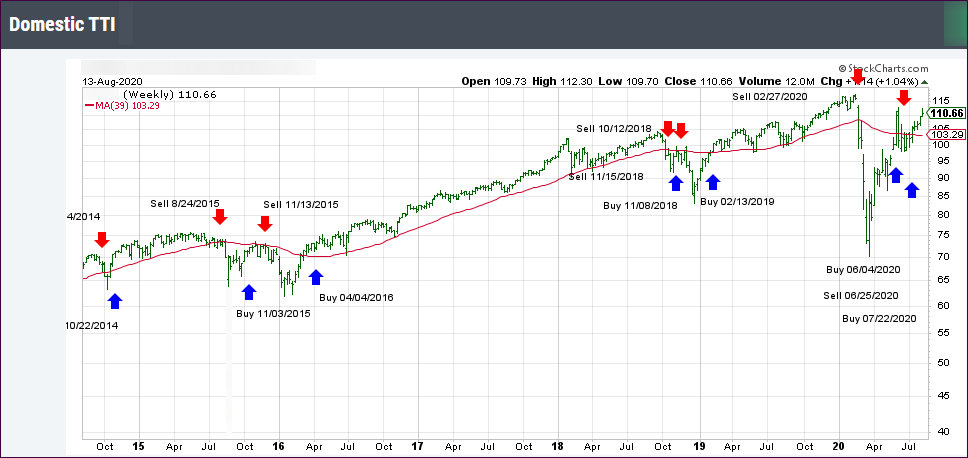
1. DOMESTIC EQUITY ETFs: BUY — since 07/22/2020 

Click on chart to enlarge

Our main directional indicator, the Domestic Trend Tracking Index (TTI-green line in the above chart) has now rallied above its long-term trend line (red) by +7.14% and remains in “BUY” mode as posted.

Read More

Chopping Around The Unchanged Line

Ulli Market Commentary Contact

[Chart courtesy of MarketWatch.com]

  1. Moving the markets

While the Dow never managed to climb above its unchanged line, the S&P 500 showed some promising early gains, only to give them back late in the session. However, the Nasdaq resisted red numbers and closed in the green, along with GLD, which added a solid +2.36% for the session.

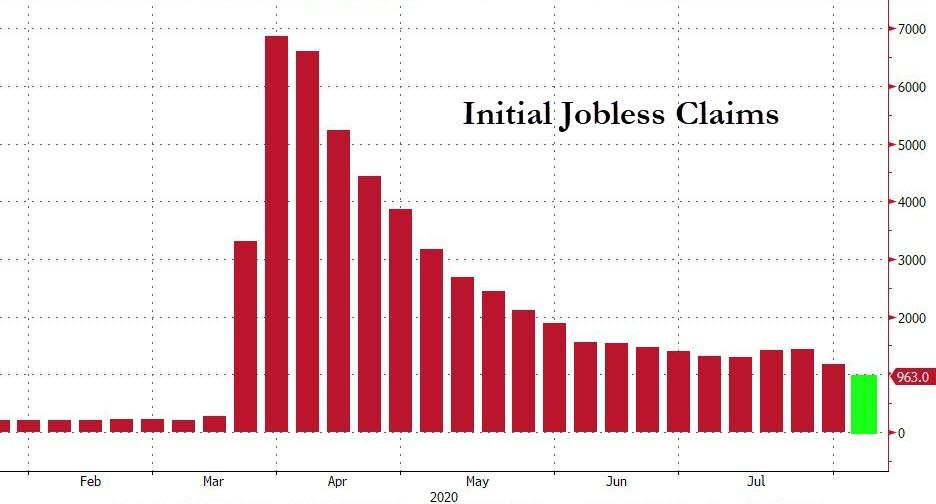
The latest jobs numbers showed initial claims falling below 1 million for the first time in 21 weeks, but still came in at a horrific 963k vs. 1.1 million expected.

Added ZH:

A total of 56.29 million Americans have now applied for jobless benefits for the first time since the pandemic lockdowns began (that’s over 360 layoffs for every COVID death in America), and massively more than the 22.1 million during the great financial crisis.

However, Despite today’s relatively positive news (yes 963,000 Americans still filed for first time benefits), following President Trump’s EOs, leaving the latest round of virus relief continuing to be stuck in gridlock, we suspect things will get depressingly worse before they get better.

That looks to be a possibility, as the ongoing impasse over Covid-19 relief is likely to drag into September with most lawmakers having retreated to their home states. In other words, we’ll have to wait for the next jawboning event.

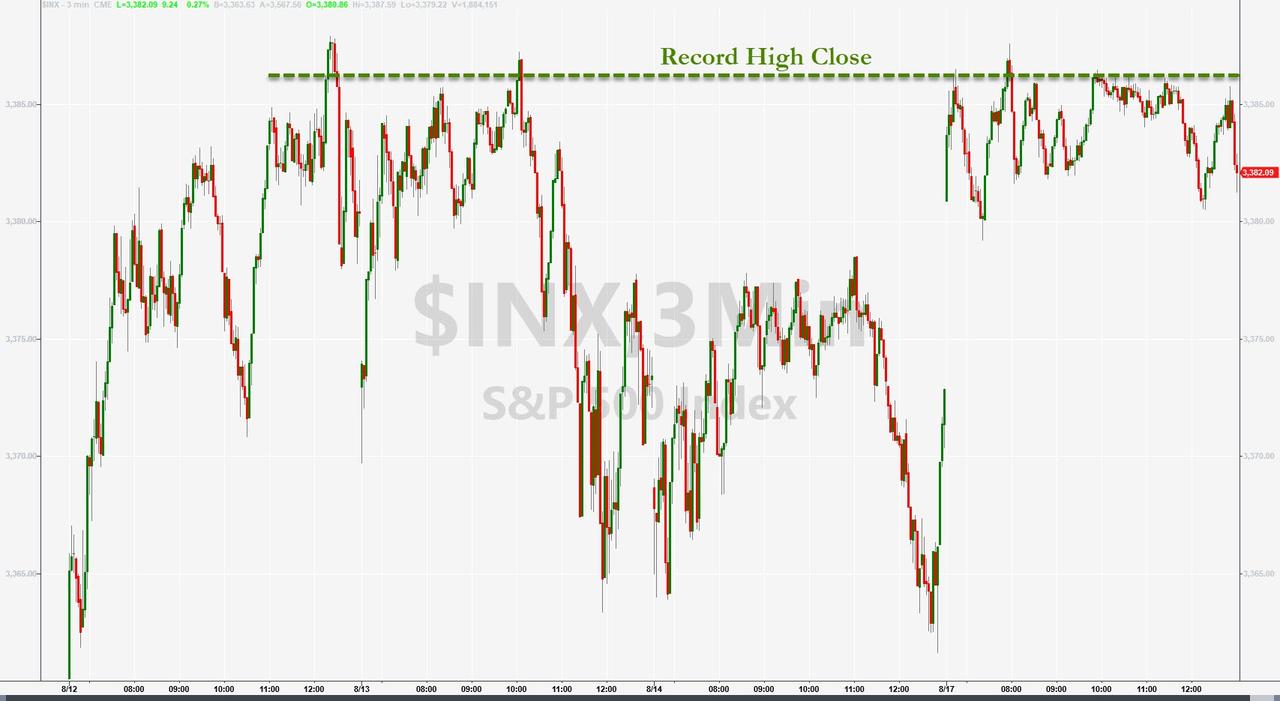
This lack of action is what keeps the markets bouncing around with the S&P 500 continuing to sniff at its all-time high but falling short of closing above it.

Not helping sentiment at all was the 30-year Treasury auction, which bombed, as yields spiked to a level last seen early July and thereby taking the steam out of the early equity rally. It was an oddity to see bonds down and gold up, since both usually run in tandem.

Oh well, I sure don’t mind seeing gold to be the winner in this battle.

Read More