
- Moving the markets
I could not help but laugh out loud last Friday afternoon when one of the greatest gold haters, namely Warren Buffett, disclosed in his Berkshire Hathaway’s latest 13F filing that he liquidated huge amounts of US Bank stocks, and replaced them as follows:
Berkshire took a new stake (20.9 million shares) in Barrick Gold, a holding that was valued at about $564 million at the end of that period.
Say what? After mocking those who believe in the soundness of gold for decades, he appeared to have flipped, which to me means that he is clearly seeing what reckless money printing will eventually do to the purchasing power of a currency.
“(Gold) gets dug out of the ground in Africa, or someplace. Then we melt it down, dig another hole, bury it again and pay people to stand around guarding it. It has no utility. Anyone watching from Mars would be scratching their head.”
Warren Buffett in 1998.
I find it amusing that he is finally seeing the light, and his purchase lit the fire under gold during this session, as the precious metal managed to almost reclaim its recently lost $2,000 level. Still, a gain of +2.19% make this a satisfying day.
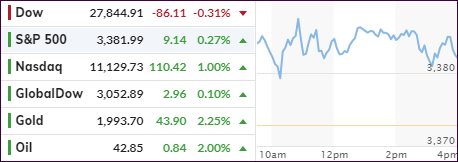
The Nasdaq set a new intraday record, came off its high but still closed the session with a solid 1% gain, thereby outperforming the S&P (+0.27%) and the Dow (-0.31%), but lagging when compared to Gold’s superior feat. Gold’s move was helped by a drop in the US dollar, which touched its late July lows.
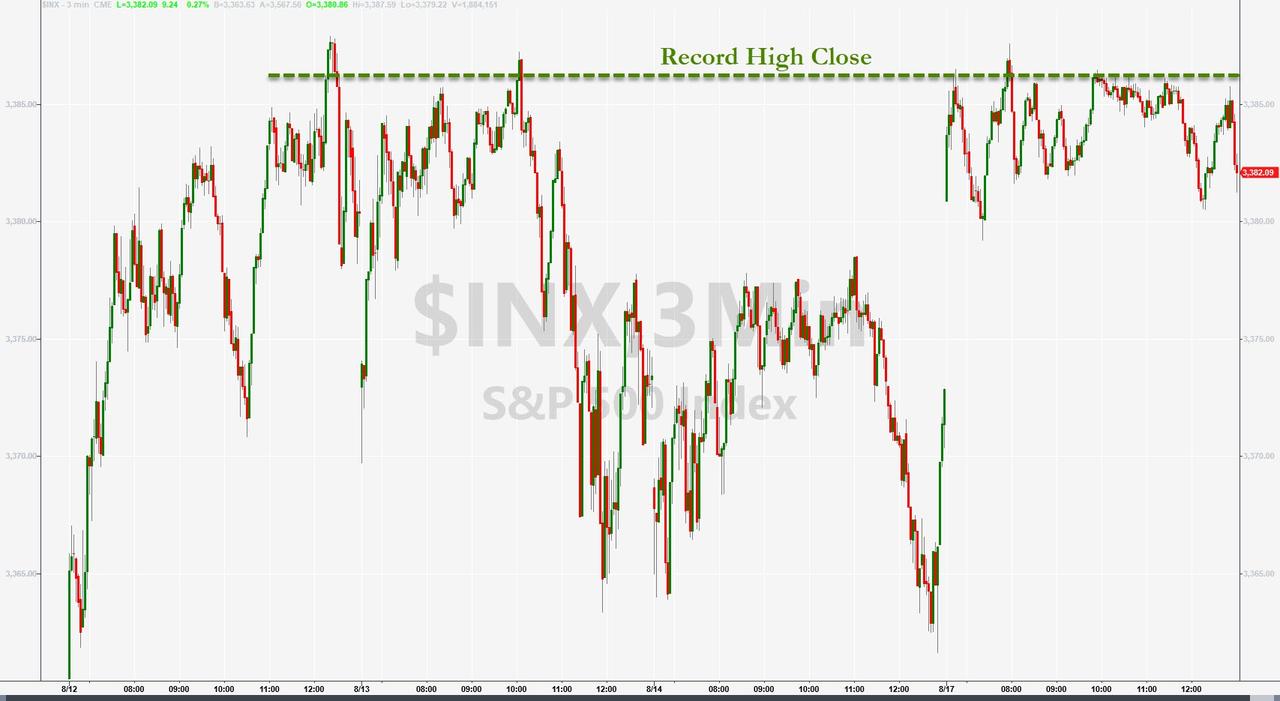
The S&P 500 remains stuck within 1% of its all-time high from February and clearly needs a new driver to propel it past that level, which it has now touched several times.
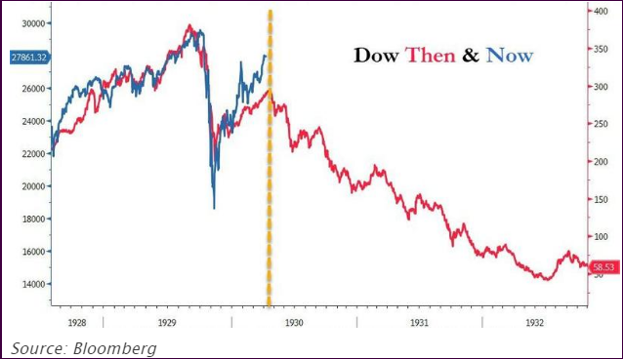
Quipped ZeroHedge tongue in cheek:
Tick-tock, time’s up for the dead-cat bounce…
2. ETFs in the Spotlight
In case you missed the announcement and description of this section, you can read it here again.
It features some of the 10 broadly diversified domestic and sector ETFs from my HighVolume list as posted every Saturday. Furthermore, they are screened for the lowest MaxDD% number meaning they have been showing better resistance to temporary sell offs than all others over the past year.
The below table simply demonstrates the magnitude with which these ETFs are fluctuating above or below their respective individual trend lines (%+/-M/A). A break below, represented by a negative number, shows weakness, while a break above, represented by a positive percentage, shows strength.
For hundreds of ETF choices, be sure to reference Thursday’s StatSheet.
For this current domestic “Buy” cycle, here’s how some our candidates have fared:
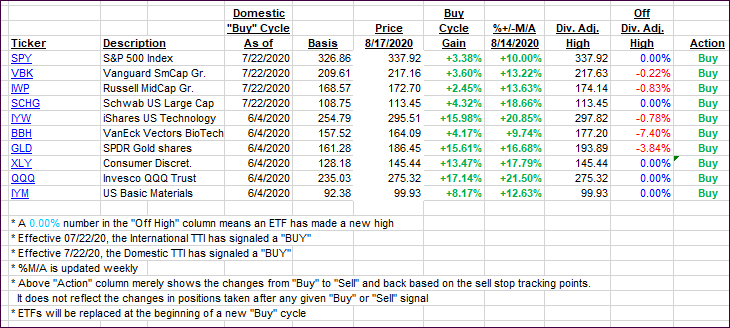
Click image to enlarge
Again, the %+/-M/A column above shows the position of the various ETFs in relation to their respective long-term trend lines, while the trailing sell stops are being tracked in the “Off High” column. The “Action” column will signal a “Sell” once the -8% point has been taken out in the “Off High” column. For more volatile sector ETFs, the trigger point is -10%.
3. Trend Tracking Indexes (TTIs)
Our TTIs changed only slightly, as today’s rally was narrow with predominantly tech and gold participating.
This is how we closed 08/17/2020:
Domestic TTI: +7.48% above its M/A (prior close +7.14%)—Buy signal effective 07/22/2020
International TTI: +5.01% above its M/A (prior close +5.05%)—Buy signal effective 07/22/2020
Disclosure: I am obliged to inform you that I, as well as my advisory clients, own some of the ETFs listed in the above table. Furthermore, they do not represent a specific investment recommendation for you, they merely show which ETFs from the universe I track are falling within the specified guidelines.
Contact Ulli