
- Moving the markets
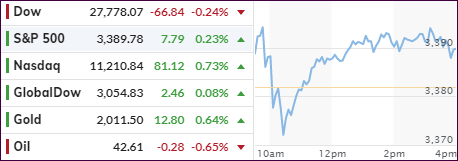
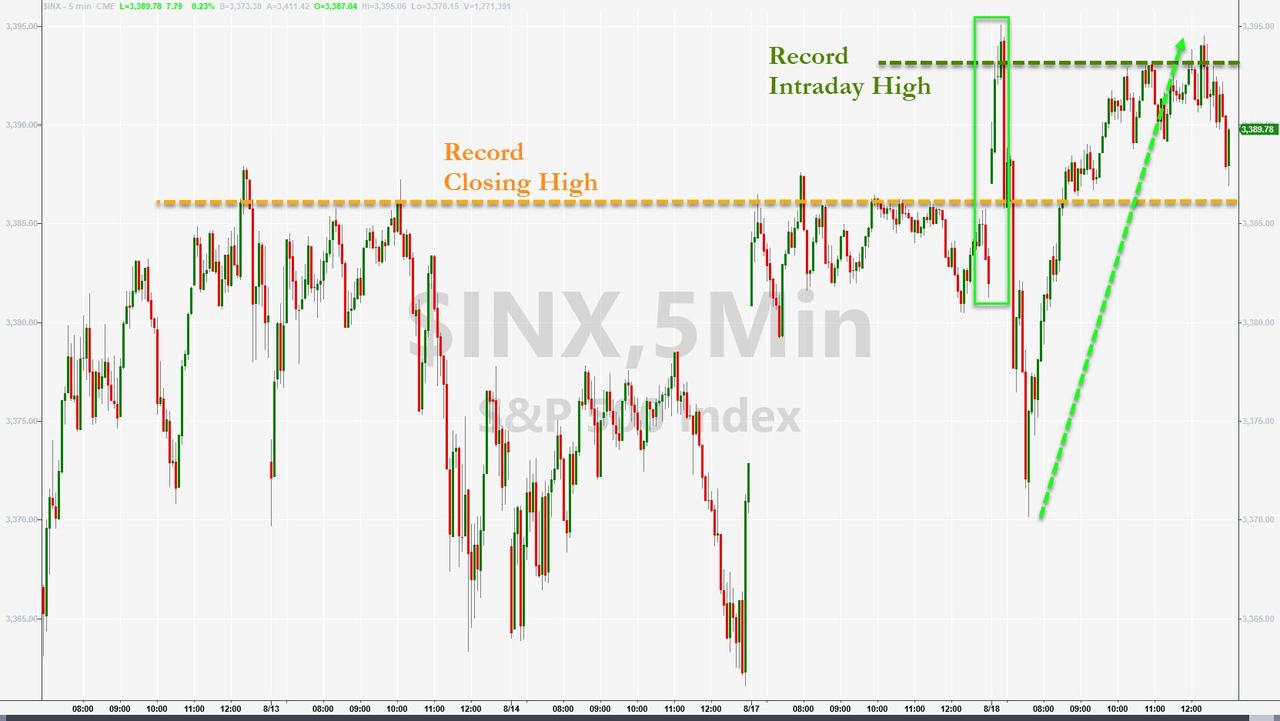
We saw a sloppy start to the session, during which the S&P 500 bounced, dropped into the red but recovered and slowly but surely climbed out of that early hole. Despite several attempts during the recent past, today was the day the index managed to set a new all-time high. Not to be outdone, the Nasdaq joined the party, but the Dow was the laggard by closing below its unchanged line.
Sure, you can read all of the accolades about this marking the fastest recovery in history, but the main reason has not been an economic recovery but merely the reckless acceleration of money printing by the Fed, which is represented in this chart by Bloomberg:

Notice how the S&P 500 has perfectly synced up with the acceleration of liquidity ever since the March meltdown. Yes, you can safely conclude that any slowdown or reduction of monetary “activity” will cause this market to crumble. That means Fed policy is committed to maintain this trend unless Fed head Powell wants to upset the applecart.
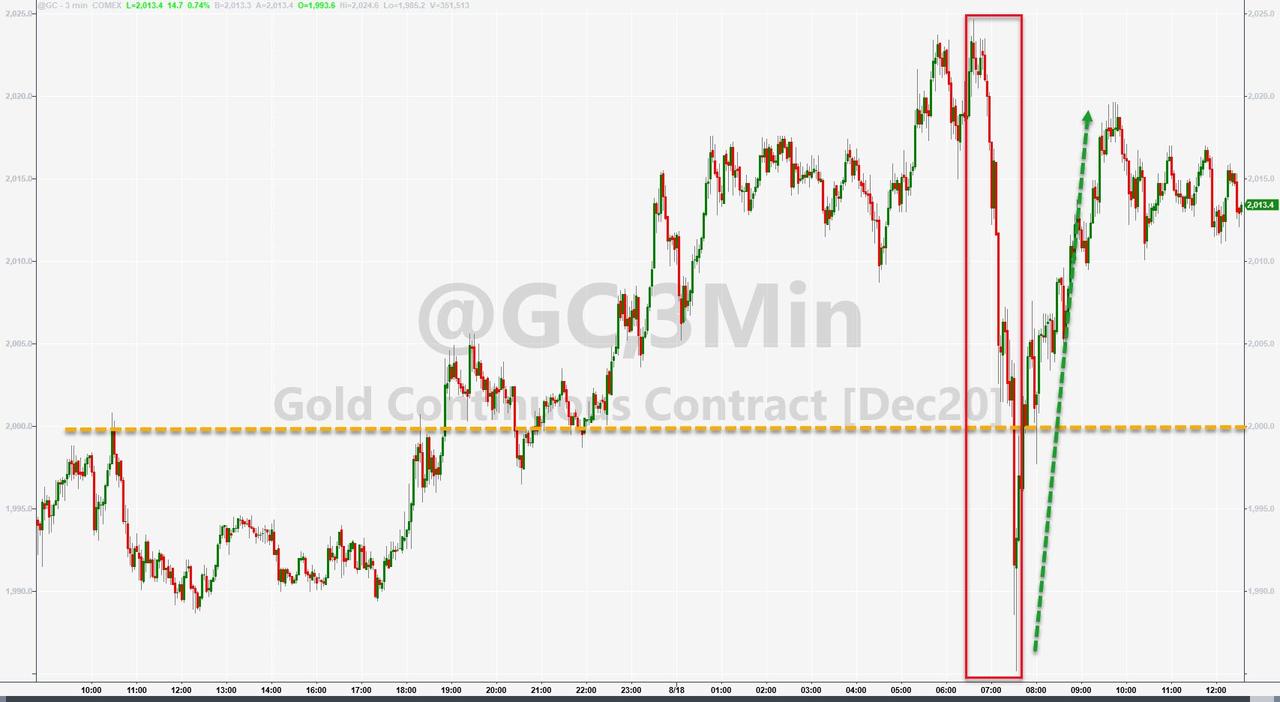
Gold managed to not only reclaim its $2k level but also close above it. It wasn’t easy, as an early rally got slammed until buyers stepped in and recouped the early losses.
The Nasdaq took top billing with a +0.73% gain, but it remains to be seen if that torrid momentum can be sustained. It would not be surprise so see some pullback from these lofty levels.
Lending market support late in the day was news that the Dems are reducing their stimulus demands by almost 50%, which makes me believe that a compromise deal may be forthcoming soon.
2. ETFs in the Spotlight
In case you missed the announcement and description of this section, you can read it here again.
It features some of the 10 broadly diversified domestic and sector ETFs from my HighVolume list as posted every Saturday. Furthermore, they are screened for the lowest MaxDD% number meaning they have been showing better resistance to temporary sell offs than all others over the past year.
The below table simply demonstrates the magnitude with which these ETFs are fluctuating above or below their respective individual trend lines (%+/-M/A). A break below, represented by a negative number, shows weakness, while a break above, represented by a positive percentage, shows strength.
For hundreds of ETF choices, be sure to reference Thursday’s StatSheet.
For this current domestic “Buy” cycle, here’s how some our candidates have fared:

Click image to enlarge
Again, the %+/-M/A column above shows the position of the various ETFs in relation to their respective long-term trend lines, while the trailing sell stops are being tracked in the “Off High” column. The “Action” column will signal a “Sell” once the -8% point has been taken out in the “Off High” column. For more volatile sector ETFs, the trigger point is -10%.
3. Trend Tracking Indexes (TTIs)
Our TTIs were mixed with the Domestic one declining and the International one gaining a tad.
This is how we closed 08/18/2020:
Domestic TTI: +6.86% above its M/A (prior close +7.48%)—Buy signal effective 07/22/2020
International TTI: +5.09% above its M/A (prior close +5.01%)—Buy signal effective 07/22/2020
Disclosure: I am obliged to inform you that I, as well as my advisory clients, own some of the ETFs listed in the above table. Furthermore, they do not represent a specific investment recommendation for you, they merely show which ETFs from the universe I track are falling within the specified guidelines.
Contact Ulli