Taking A Breather

Ulli Market Commentary Contact

[Chart courtesy of MarketWatch.com]

  1. Moving the markets

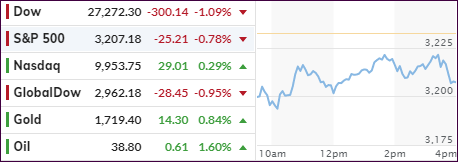
The futures markets already indicated a weak opening with equities taking a leg lower based on worries that the current historic rally has exceeded the economic recovery. This was not surprising news, but the real culprit causing some anxiety may have been the upcoming revelation of any policy adjustments to be made during the current two-day Fed meeting. The announcement will be tomorrow around lunch time.

While no major changes are expected, the focus will be on the publication of economic projections, the first ones since last December. None of them were issued during the Covid-19 crisis.

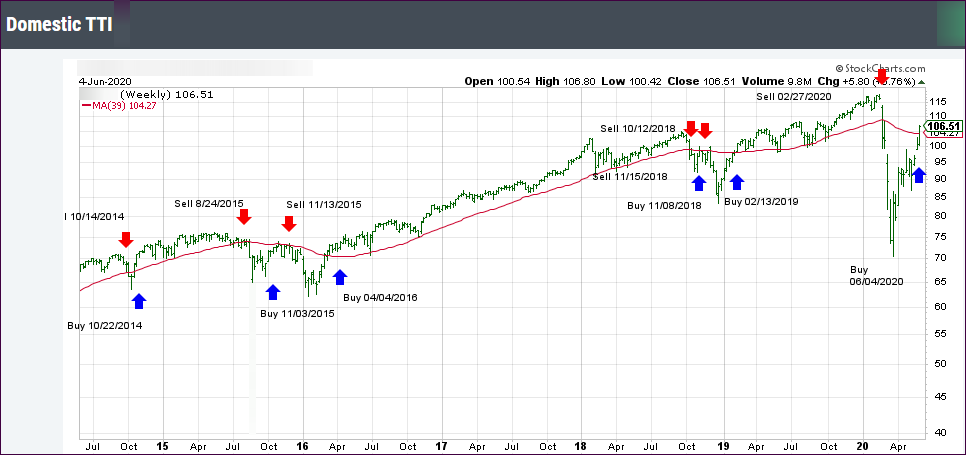
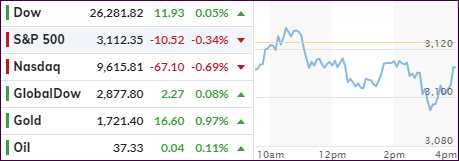
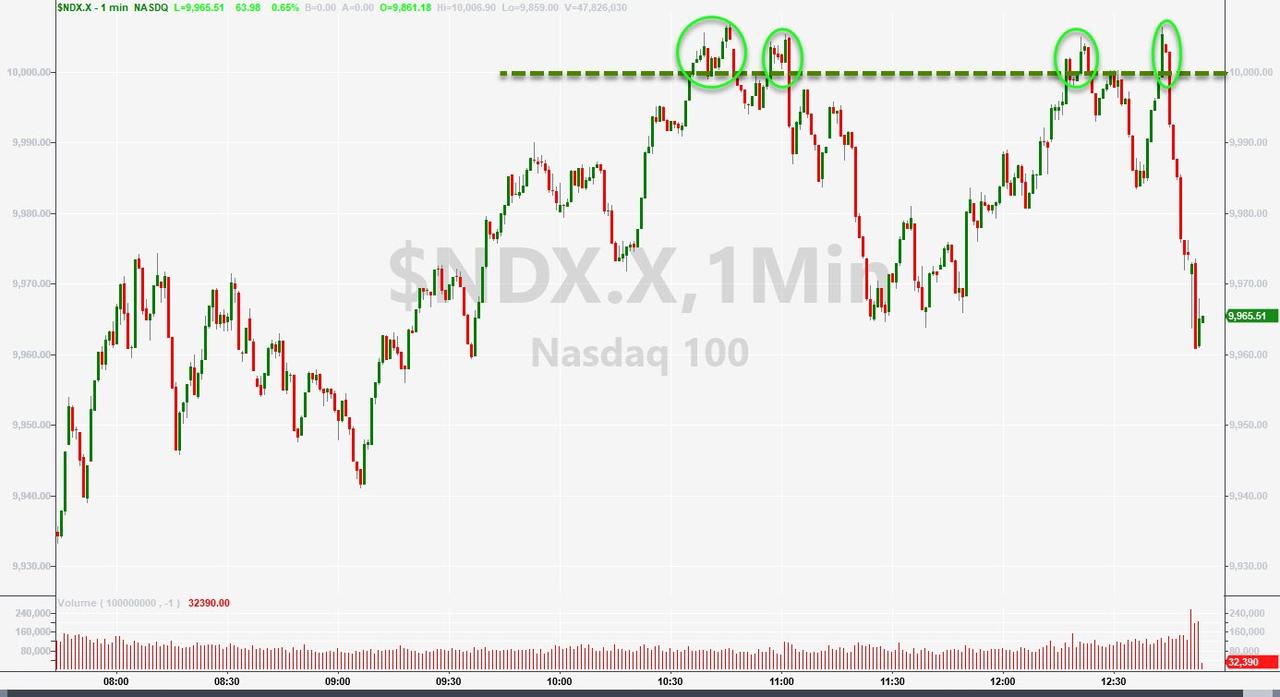
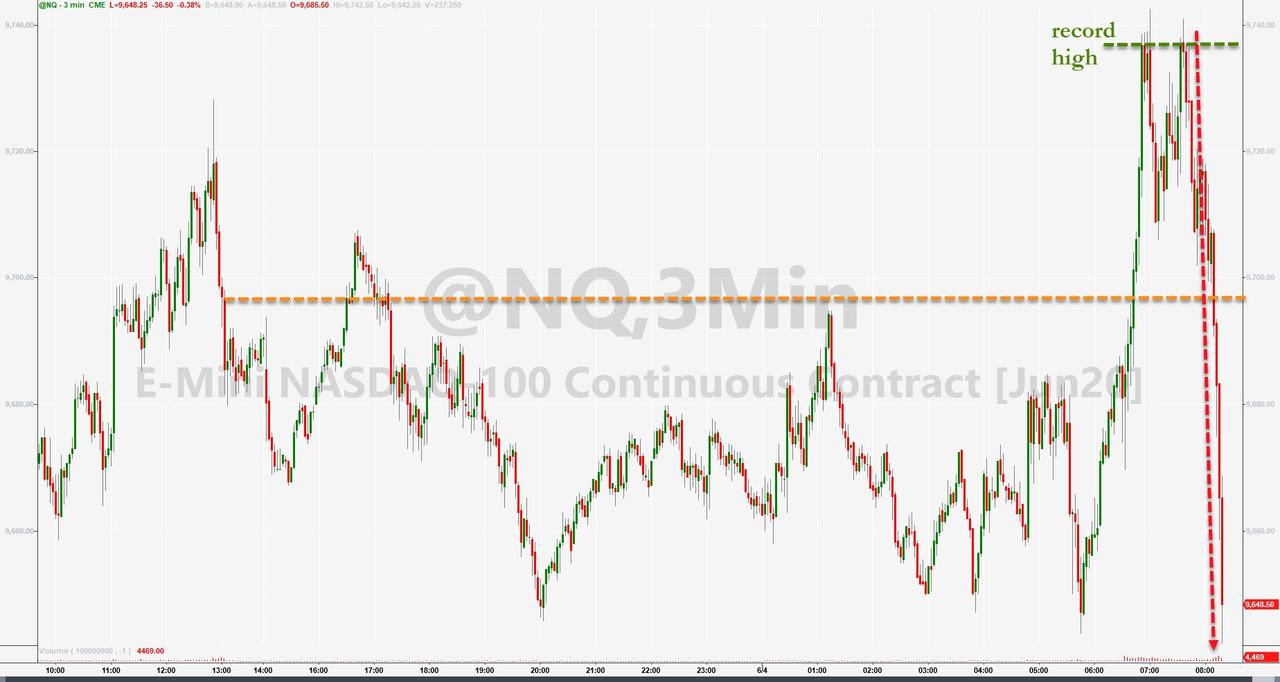
For a change, an afternoon rebound did not materialize, and the major indexes slipped, but the Nasdaq scored another record high and briefly surpassed its 10k level but could not hold it into the close. Nevertheless, it has been an amazing run for the tech heavyweight, especially when considering that the current price is out of sync with forward earnings.

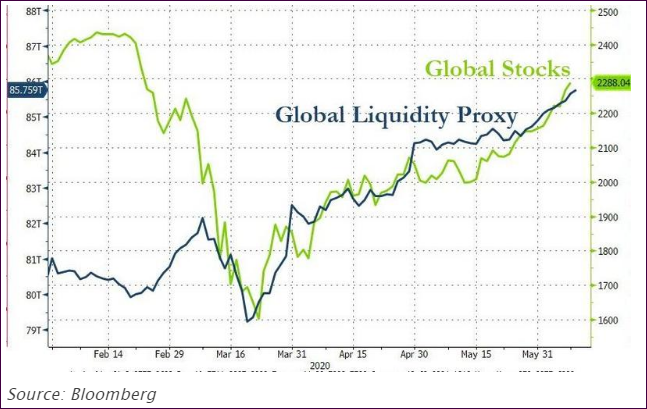
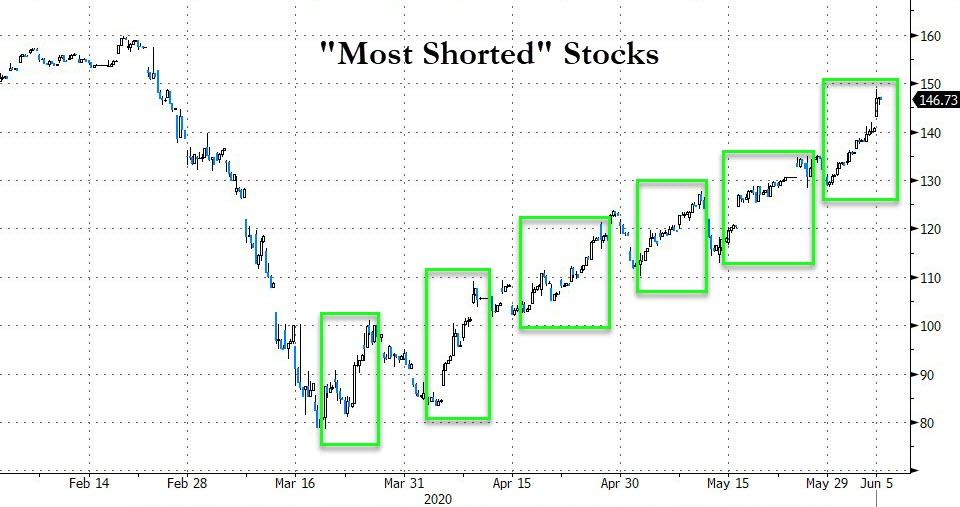
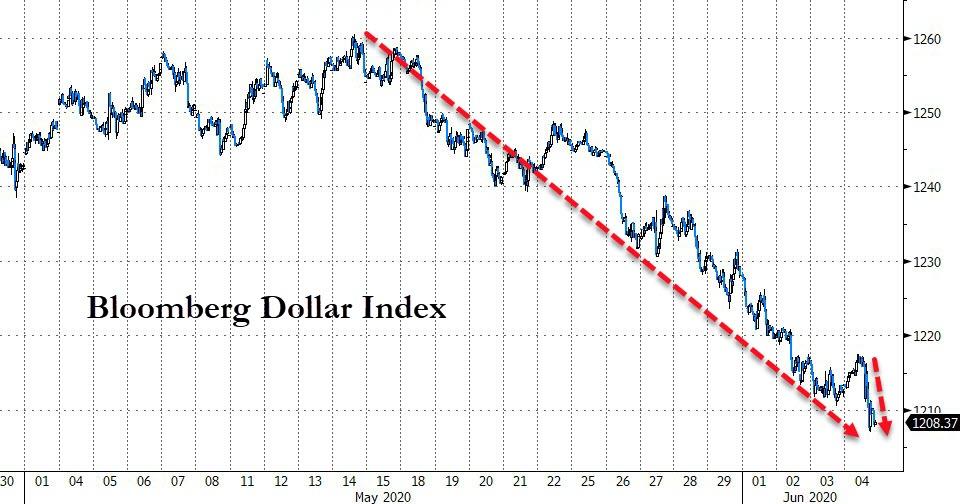
And to remind you again that global liquidity is at the center of this rebound, this chart tells all:

Read More

Maintaining Upward Momentum

Ulli Market Commentary Contact

[Chart courtesy of MarketWatch.com]

  1. Moving the markets

Friday’s upward momentum carried into this week with the major indexes relentlessly reaching for higher levels with the Nasdaq ending at a record high for the first time since February. If this any indication, the Dow and the S&P 500 are on track to follow suit.

Obviously, traders consider the Fed’s actions of keeping credit flowing during this pandemic, AKA reckless money printing efforts, highly successful, thereby totally ignoring the long-term consequences of such actions.

This week, the focus will be on the Fed’s announcement of their updated policy statement on Wednesday, which is set to include the first release of economic projections since December. Expectations are that the central bank will keep interest rates low and hope that more stimulus will be forthcoming will play big role in further market advances.

Should the May jobs report convince these central planners that no more stimulus is needed, the markets will not take that too kindly and will most likely sell off.

You will have heard many opinions as to the varies types of economic recovery we might be in for. Obviously, the most hoped for is the V-shape, which we have seen in equities, as they bounced off the March lows in an almost straight line.

The same can’t be said for the economy, and the various come-back possibilities are explained in this chart:

The jury is still out, but right now it seems that W- or L-shape rebounds reflect current realities, while the V-shape option is a pipedream.

Today’s ramp pushed our International Trend Tracking Index (TTI) above its trend line as well, thereby generating a new “Buy” for “broadly diversified international ETFs/mutual funds.” The effective date will be tomorrow, June 9, 2020, unless there is a large sell-off in the making, at which time, we will hold off another day before making commitments.

Read More

ETFs On The Cutline – Updated Through 06/05/2020

Ulli ETFs on the Cutline Contact

Below, please find the latest High-Volume ETF Cutline report, which shows how far above or below their respective long-term trend lines (39-week SMA) my currently tracked ETFs are positioned.

This report covers the HV ETF Master List from Thursday’s StatSheet and includes 322 High Volume ETFs, defined as those with an average daily volume of more than $5 million, of which currently 179 (last week 107) are hovering in bullish territory. The yellow line separates those ETFs that are positioned above their trend line (%M/A) from those that have dropped below it.

Take a look:                                                                   

The HV ETF Master Cutline Report

In case you are not familiar with some of the terminology used in the reports, please read the Glossary of Terms. If you missed the original post about the Cutline approach, you can read it here.

ETF Tracker Newsletter For June 5, 2020

Ulli ETF Tracker Contact

ETF Tracker StatSheet          

You can view the latest version here.

STARTING THE NEW “BUY” SIGNAL WITH A BANG

[Chart courtesy of MarketWatch.com]

  1. Moving the markets

The bulls came out swinging for the fences right after the opening bell, with the Dow surging over 1,000 points before settling for a gain of some +3.15% (829 points) supported by another giant short squeeze.

The culprit behind this monster move was a jobs report surprise to the upside with May payrolls soaring by +2.5 million and crushing bearish expectations of another big wave of layoffs of around -7.25 million.

The unemployment rate fell to 13.3% from 14.7% vs. 19% expected, thereby signaling that the economy has indeed began to recover. Sure, every state had started to reopen their economies by varying degrees, but not to the extent that would justify such a rebound.

What other reason could have caused such sparkling numbers? One analyst questioned the statistics and explained them this way:

‘Everybody seems to have forgotten about the PPP loans. 20 million private sector “employees” went from unemployed and collecting unemployment benefits, to employed and getting paid with PPP loans/grants, so are now being paid by the US Govt via these PPP loans (just started being doled out in May), and being reported as “employed” (whether they are working or not).  Without the PPP loans, those 20 million “employed” would go “poof” and become unemployed.

And, if that wasn’t egregious enough, the Labor Department admitted that government household survey-takers mistakenly counted about 4.9 million temporarily laid-off people as employed. The government doesn’t correct its survey results for fear of the appearance of political manipulation.  Had the mistake been corrected, the unemployment rate would have risen to 16.1 percent in May, and the corrected April figure would have been more than than 19 percent.’

Be that as it may, today’s monster rally supported our current “Buy” signal, which was effective yesterday, and also brought our International Trend Tracking Index (TTI) within striking distance of generating a new “Buy” as well. We will have to wait until next week to see if that materializes.

Our exit strategy is clearly defined, and we will apply it “if” the need arises.

Read More

Weekly StatSheet For The ETF Tracker Newsletter – Updated Through 06/04/2020

Ulli ETF StatSheet Contact

ETF Data updated through Thursday, June 4, 2020

Methodology/Use of this StatSheet:

1. From the universe of over 1,800 ETFs, I have selected only those with a trading volume of over $5 million per day (HV ETFs), so that liquidity and a small bid/ask spread are assured.

2. Trend Tracking Indexes (TTIs)

Buy or Sell decisions for Domestic and International ETFs (section 1 and 2), are made based on the respective TTI and its position either above or below its long-term M/A (Moving Average). A crossing of the trend line from below accompanied by some staying power above constitutes a “Buy” signal. Conversely, a clear break below the line constitutes a “Sell” signal. Additionally, I use a 7.5% trailing stop loss on all positions in these categories to control downside risk.

3. All other investment arenas do not have a TTI and should be traded based on  the position of the individual ETF relative to its own respective trend line (%M/A). That’s why those signals are referred to as a “Selective Buy.” In other words, if an ETF crosses its own trendline to the upside, a “Buy” signal is generated. Since these areas tend to be more volatile, I recommend a wider trailing sell stop of 7.5% -10% depending on your risk tolerance.

If you are unfamiliar with some of the terminology, please see Glossary of Terms and new subscriber information in section 9.     

1. DOMESTIC EQUITY ETFs: BUY — since 04/06/2020


Click on chart to enlarge

Our main directional indicator, the Domestic Trend Tracking Index (TTI-green line in the above chart) is now positioned above its long-term trend line (red) by +2.17% after having generated a new Domestic “Sell” signal effective 06/04/20 as posted.

Read More

Treading Water

Ulli Market Commentary Contact

[Chart courtesy of MarketWatch.com]

  1. Moving the markets

The markets bounced around aimlessly all day, with the Nasdaq scoring a new intra-day all-time high early on, despite deteriorating earnings, which apparently was more than traders could handle, and the index headed south for no apparent reason. The Dow and the S&P 500 joined the slide, but only the Dow managed to climb back to the unchanged line.  

Jobless claims were the center of attention, as we learned that “only” 1.87 million people started to claim unemployment last week. For sure, as Bloomberg’s chart shows, the trend is improving, however, the fact is that the eleven-week total of job losses has reached now 42.644 million, which is the worst ever in American history.

Still, this question, as posted by ZH, seems to be on peoples’ minds, although I have answered it on many occasions:

1. What is driving the swift recovery of equities?

a) Fed – 73%

b) Earnings Optimism – 0%

c) Labor market recovery – 6%

d) Further fiscal stimulus – 5%

And if Fed policy supports the bullish theme via its balance sheet expansion, that rally will continue—until one day, when it won’t. That’s why I keep harping on the importance of having a sell stop, just so you can be prepared for that moment in time when this party ends.

Effective today, our domestic “Buy” signal has been confirmed, and we will remain invested, subject to our trailing sell stops.

The whipping boy of the last few weeks has been the US Dollar, which has presented us with the biggest 14-day drop since October 2011, according to ZH. Could this be a precursor of an increase in inflationary trends?

Be that as it may, right now we will follow the major trends in the markets, which according to my work shows that we could be in the beginning stages of a new bull run. Could it reverse? Sure, that’s why we have trailing sell stops to help us with managing portfolio risk.

Read More