
ETF Tracker StatSheet
You can view the latest version here.
STARTING THE NEW “BUY” SIGNAL WITH A BANG
- Moving the markets
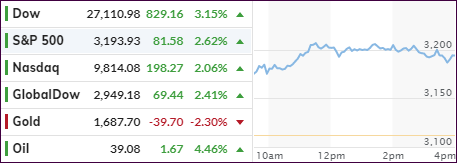
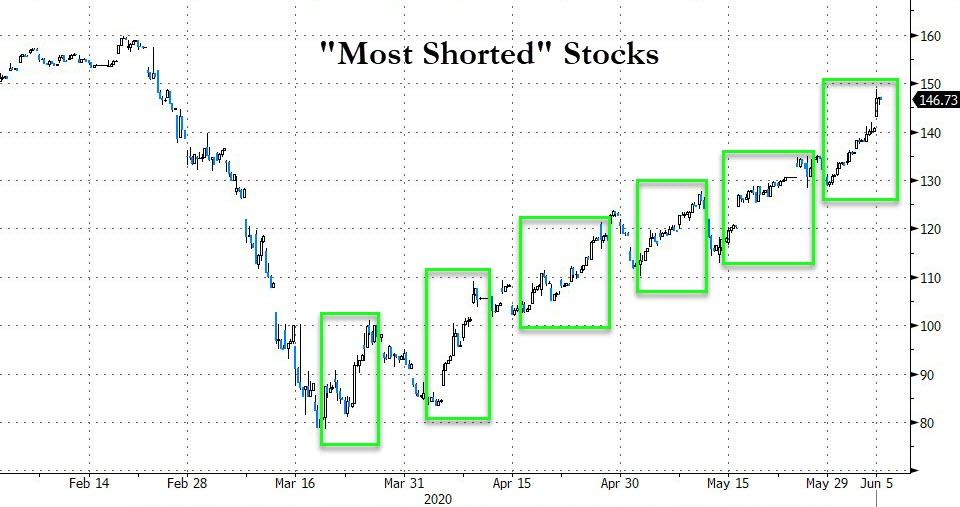
The bulls came out swinging for the fences right after the opening bell, with the Dow surging over 1,000 points before settling for a gain of some +3.15% (829 points) supported by another giant short squeeze.
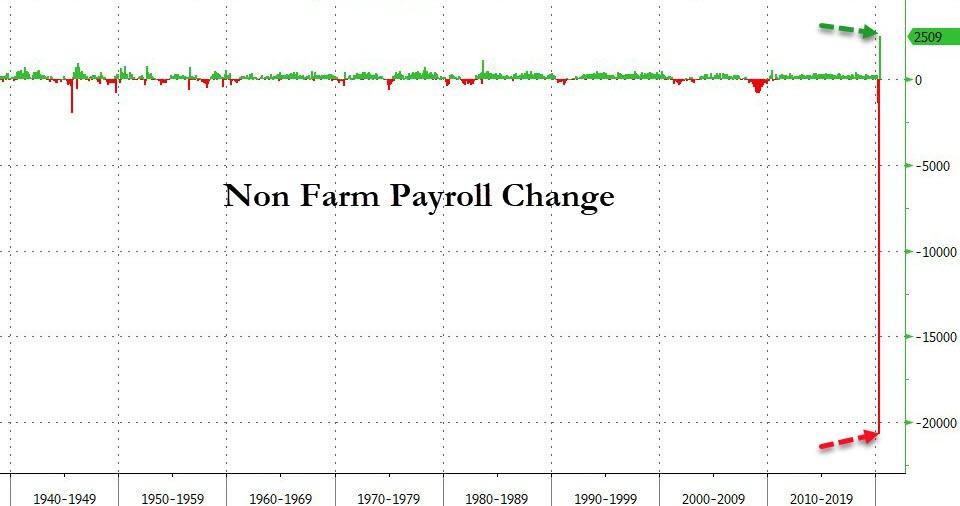
The culprit behind this monster move was a jobs report surprise to the upside with May payrolls soaring by +2.5 million and crushing bearish expectations of another big wave of layoffs of around -7.25 million.
The unemployment rate fell to 13.3% from 14.7% vs. 19% expected, thereby signaling that the economy has indeed began to recover. Sure, every state had started to reopen their economies by varying degrees, but not to the extent that would justify such a rebound.
What other reason could have caused such sparkling numbers? One analyst questioned the statistics and explained them this way:
‘Everybody seems to have forgotten about the PPP loans. 20 million private sector “employees” went from unemployed and collecting unemployment benefits, to employed and getting paid with PPP loans/grants, so are now being paid by the US Govt via these PPP loans (just started being doled out in May), and being reported as “employed” (whether they are working or not). Without the PPP loans, those 20 million “employed” would go “poof” and become unemployed.
And, if that wasn’t egregious enough, the Labor Department admitted that government household survey-takers mistakenly counted about 4.9 million temporarily laid-off people as employed. The government doesn’t correct its survey results for fear of the appearance of political manipulation. Had the mistake been corrected, the unemployment rate would have risen to 16.1 percent in May, and the corrected April figure would have been more than than 19 percent.’
Be that as it may, today’s monster rally supported our current “Buy” signal, which was effective yesterday, and also brought our International Trend Tracking Index (TTI) within striking distance of generating a new “Buy” as well. We will have to wait until next week to see if that materializes.
Our exit strategy is clearly defined, and we will apply it “if” the need arises.
2. ETFs in the Spotlight
In case you missed the announcement and description of this section, you can read it here again.
It features some of the 10 broadly diversified domestic and sector ETFs from my HighVolume list as posted every Saturday. Furthermore, they are screened for the lowest MaxDD% number meaning they have been showing better resistance to temporary sell offs than all others over the past year.
The below table simply demonstrates the magnitude with which these ETFs are fluctuating above or below their respective individual trend lines (%+/-M/A). A break below, represented by a negative number, shows weakness, while a break above, represented by a positive percentage, shows strength.
For hundreds of ETF choices, be sure to reference Thursday’s StatSheet.
For this new domestic “Buy” cycle, which was effective 6/4/2020, here’s how some our candidates have fared:
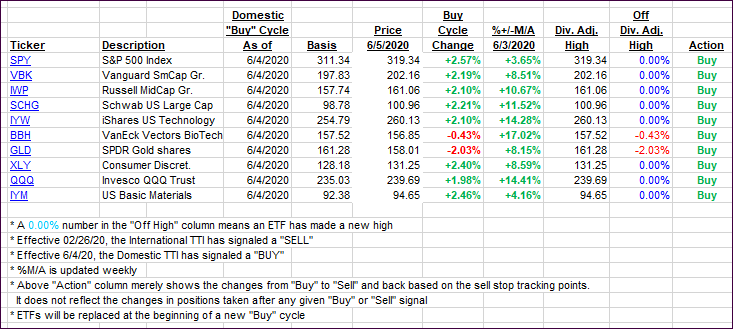
Click image to enlarge
Again, the %+/-M/A column above shows the position of the various ETFs in relation to their respective long-term trend lines, while the trailing sell stops are being tracked in the “Off High” column. The “Action” column will signal a “Sell” once the -8% point has been taken out in the “Off High” column. For more volatile sector ETFs, the trigger point is -10%.
3. Trend Tracking Indexes (TTIs)
Our TTIs soared with the markets confirming our Domestic “Buy” and International one only needing a gentle push to reach green territory.
This is how we closed 06/05/2020:
Domestic TTI: +5.82% above its M/A (prior close +1.65%)—Buy signal effective 06/04/2020
International TTI: -0.00% below its M/A (prior close -2.58%)—Sell signal effective 02/26/2020
Disclosure: I am obliged to inform you that I, as well as my advisory clients, own some of the ETFs listed in the above table. Furthermore, they do not represent a specific investment recommendation for you, they merely show which ETFs from the universe I track are falling within the specified guidelines.
———————————————————-
WOULD YOU LIKE TO HAVE YOUR INVESTMENTS PROFESSIONALLY MANAGED?
Do you have the time to follow our investment plans yourself? If you are a busy professional who would like to have his portfolio managed using our methodology, please contact me directly or get more details here.
———————————————————
Back issues of the ETF Tracker are available on the web.
Contact Ulli