- Moving the markets
Friday’s upward momentum carried into this week with the major indexes relentlessly reaching for higher levels with the Nasdaq ending at a record high for the first time since February. If this any indication, the Dow and the S&P 500 are on track to follow suit.
Obviously, traders consider the Fed’s actions of keeping credit flowing during this pandemic, AKA reckless money printing efforts, highly successful, thereby totally ignoring the long-term consequences of such actions.
This week, the focus will be on the Fed’s announcement of their updated policy statement on Wednesday, which is set to include the first release of economic projections since December. Expectations are that the central bank will keep interest rates low and hope that more stimulus will be forthcoming will play big role in further market advances.
Should the May jobs report convince these central planners that no more stimulus is needed, the markets will not take that too kindly and will most likely sell off.
You will have heard many opinions as to the varies types of economic recovery we might be in for. Obviously, the most hoped for is the V-shape, which we have seen in equities, as they bounced off the March lows in an almost straight line.
The same can’t be said for the economy, and the various come-back possibilities are explained in this chart:

The jury is still out, but right now it seems that W- or L-shape rebounds reflect current realities, while the V-shape option is a pipedream.
Today’s ramp pushed our International Trend Tracking Index (TTI) above its trend line as well, thereby generating a new “Buy” for “broadly diversified international ETFs/mutual funds.” The effective date will be tomorrow, June 9, 2020, unless there is a large sell-off in the making, at which time, we will hold off another day before making commitments.
2. ETFs in the Spotlight
In case you missed the announcement and description of this section, you can read it here again.
It features some of the 10 broadly diversified domestic and sector ETFs from my HighVolume list as posted every Saturday. Furthermore, they are screened for the lowest MaxDD% number meaning they have been showing better resistance to temporary sell offs than all others over the past year.
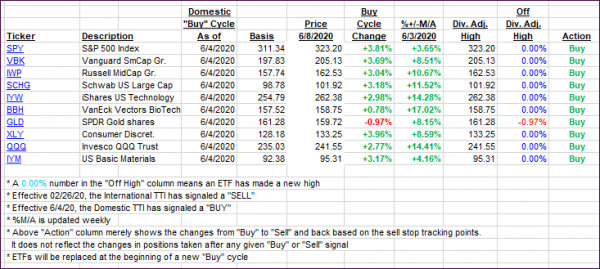
The below table simply demonstrates the magnitude with which these ETFs are fluctuating above or below their respective individual trend lines (%+/-M/A). A break below, represented by a negative number, shows weakness, while a break above, represented by a positive percentage, shows strength.
For hundreds of ETF choices, be sure to reference Thursday’s StatSheet.
For this new domestic “Buy” cycle, which was effective 6/4/2020, here’s how some our candidates have fared:

Click image to enlarge
Again, the %+/-M/A column above shows the position of the various ETFs in relation to their respective long-term trend lines, while the trailing sell stops are being tracked in the “Off High” column. The “Action” column will signal a “Sell” once the -8% point has been taken out in the “Off High” column. For more volatile sector ETFs, the trigger point is -10%.
3. Trend Tracking Indexes (TTIs)
Our TTIs jumped as the rally continued full steam pushing our International TTI into “Buy” mode as well, as explained above.
This is how we closed 06/08/2020:
Domestic TTI: +8.35% above its M/A (prior close +5.82%)—Buy signal effective 06/04/2020
International TTI: +1.35% above its M/A (prior close -0.00%)—Buy signal effective 06/09/2020
Disclosure: I am obliged to inform you that I, as well as my advisory clients, own some of the ETFs listed in the above table. Furthermore, they do not represent a specific investment recommendation for you, they merely show which ETFs from the universe I track are falling within the specified guidelines.
Contact Ulli