
- Moving the markets
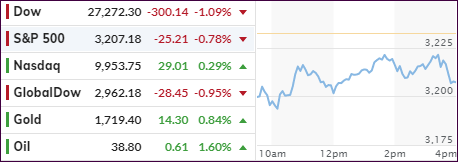
The futures markets already indicated a weak opening with equities taking a leg lower based on worries that the current historic rally has exceeded the economic recovery. This was not surprising news, but the real culprit causing some anxiety may have been the upcoming revelation of any policy adjustments to be made during the current two-day Fed meeting. The announcement will be tomorrow around lunch time.
While no major changes are expected, the focus will be on the publication of economic projections, the first ones since last December. None of them were issued during the Covid-19 crisis.
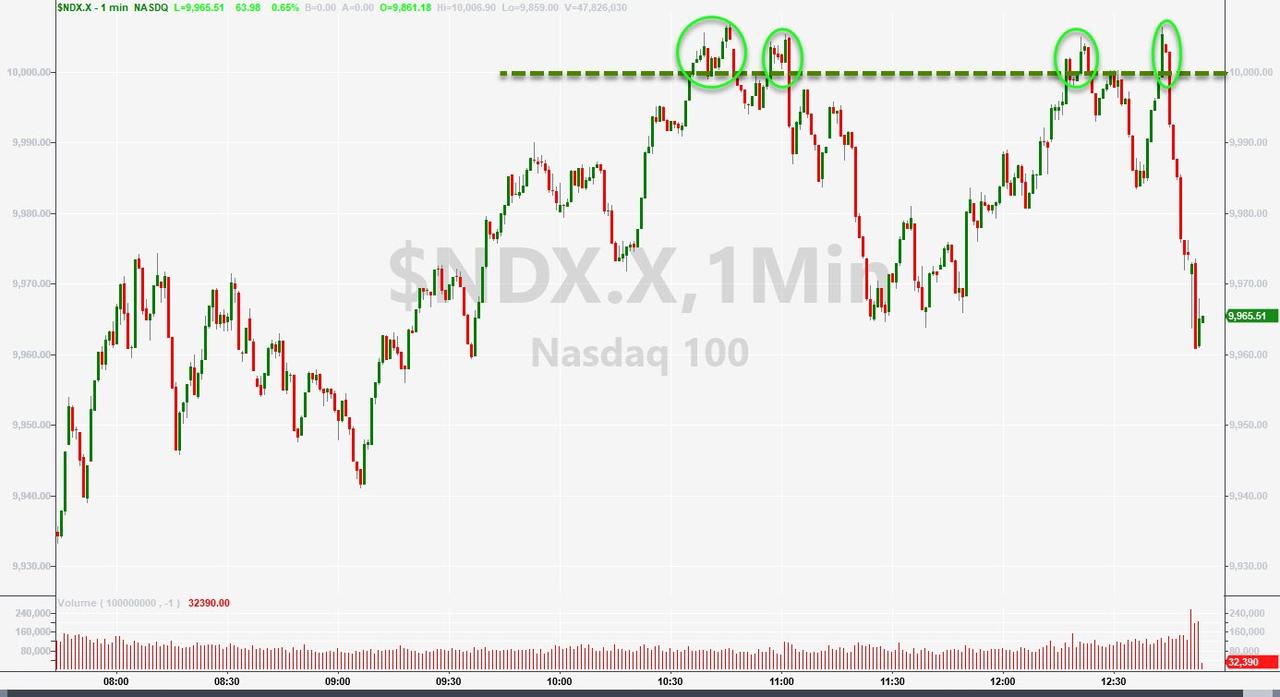
For a change, an afternoon rebound did not materialize, and the major indexes slipped, but the Nasdaq scored another record high and briefly surpassed its 10k level but could not hold it into the close. Nevertheless, it has been an amazing run for the tech heavyweight, especially when considering that the current price is out of sync with forward earnings.
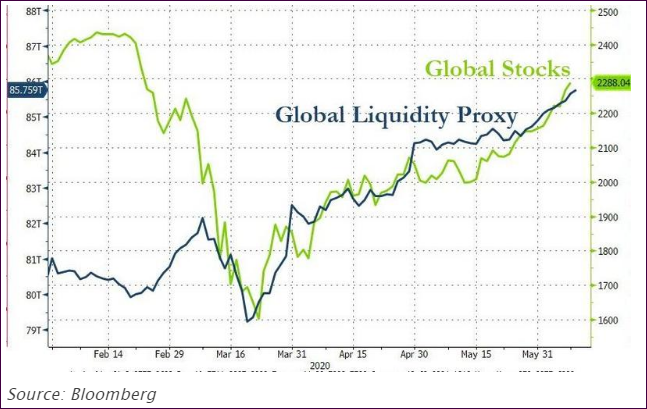
And to remind you again that global liquidity is at the center of this rebound, this chart tells all:
2. ETFs in the Spotlight
In case you missed the announcement and description of this section, you can read it here again.
It features some of the 10 broadly diversified domestic and sector ETFs from my HighVolume list as posted every Saturday. Furthermore, they are screened for the lowest MaxDD% number meaning they have been showing better resistance to temporary sell offs than all others over the past year.
The below table simply demonstrates the magnitude with which these ETFs are fluctuating above or below their respective individual trend lines (%+/-M/A). A break below, represented by a negative number, shows weakness, while a break above, represented by a positive percentage, shows strength.
For hundreds of ETF choices, be sure to reference Thursday’s StatSheet.
For this new domestic “Buy” cycle, which was effective 6/4/2020, here’s how some our candidates have fared:
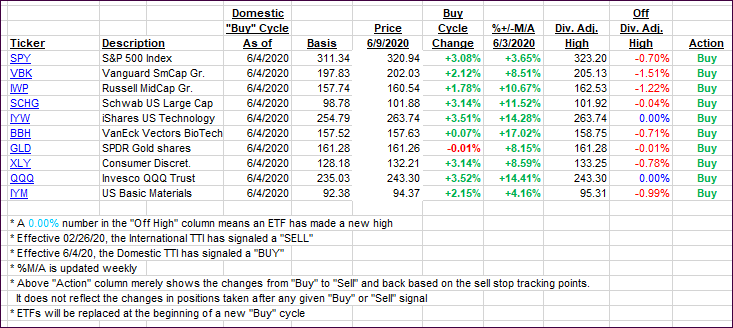
Click image to enlarge
Again, the %+/-M/A column above shows the position of the various ETFs in relation to their respective long-term trend lines, while the trailing sell stops are being tracked in the “Off High” column. The “Action” column will signal a “Sell” once the -8% point has been taken out in the “Off High” column. For more volatile sector ETFs, the trigger point is -10%.
3. Trend Tracking Indexes (TTIs)
Our TTIs slipped, as the markets were in sell-off mode early on with the Dow showing losses of some 350 points. As posted yesterday, this pullback made me wait with executing the newly created International “Buy.” I want to see this index display a little more staying power above its trend line before pulling the trigger.
This is how we closed 06/09/2020:
Domestic TTI: +5.64% above its M/A (prior close +8.35%)—Buy signal effective 06/04/2020
International TTI: +0.44% above its M/A (prior close +1.35%)—Sell signal effective 02/26/2020
Disclosure: I am obliged to inform you that I, as well as my advisory clients, own some of the ETFs listed in the above table. Furthermore, they do not represent a specific investment recommendation for you, they merely show which ETFs from the universe I track are falling within the specified guidelines.
Contact Ulli