
- Moving the markets
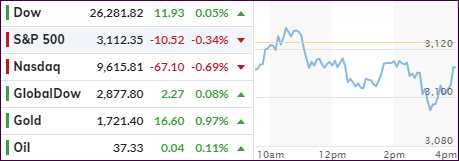
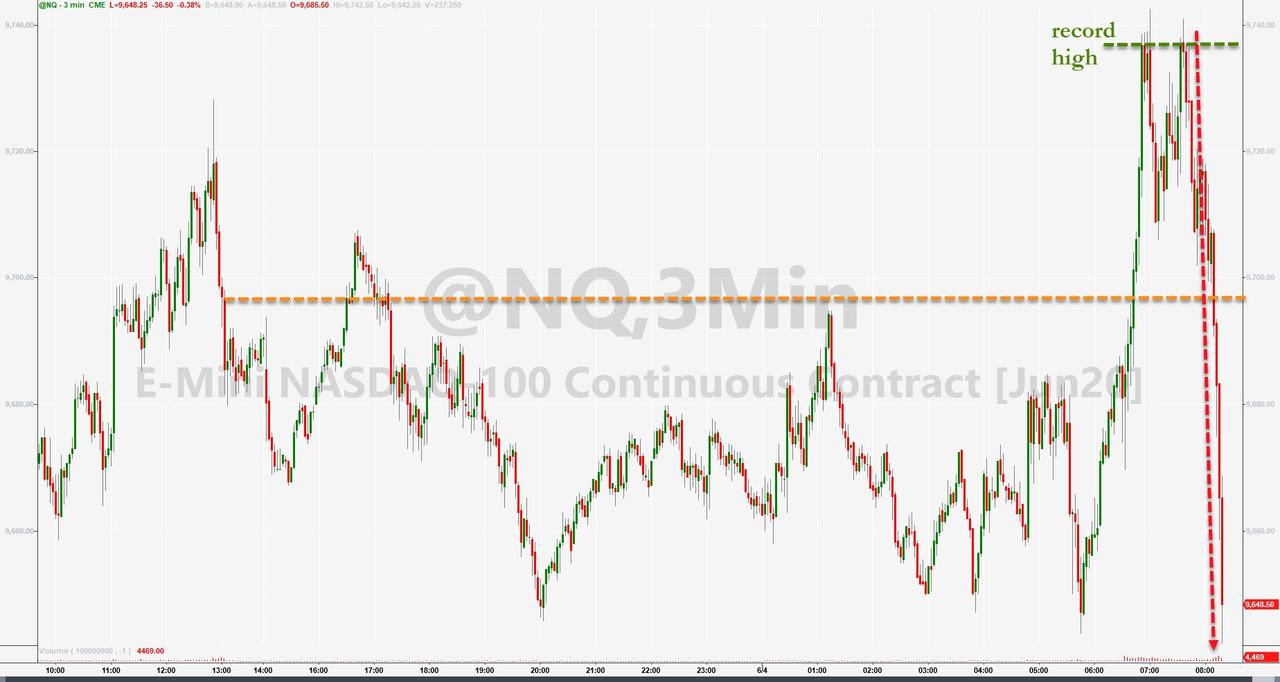
The markets bounced around aimlessly all day, with the Nasdaq scoring a new intra-day all-time high early on, despite deteriorating earnings, which apparently was more than traders could handle, and the index headed south for no apparent reason. The Dow and the S&P 500 joined the slide, but only the Dow managed to climb back to the unchanged line.
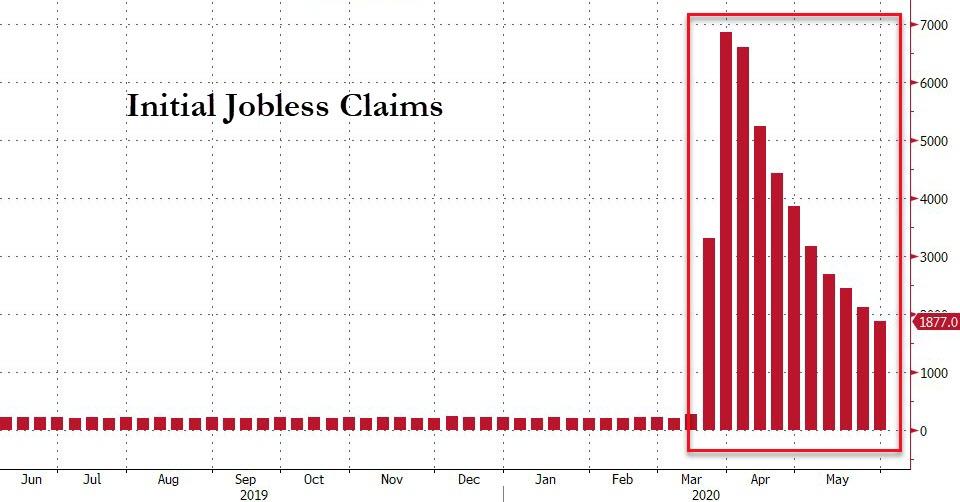
Jobless claims were the center of attention, as we learned that “only” 1.87 million people started to claim unemployment last week. For sure, as Bloomberg’s chart shows, the trend is improving, however, the fact is that the eleven-week total of job losses has reached now 42.644 million, which is the worst ever in American history.
Still, this question, as posted by ZH, seems to be on peoples’ minds, although I have answered it on many occasions:
1. What is driving the swift recovery of equities?
a) Fed – 73%
b) Earnings Optimism – 0%
c) Labor market recovery – 6%
d) Further fiscal stimulus – 5%
And if Fed policy supports the bullish theme via its balance sheet expansion, that rally will continue—until one day, when it won’t. That’s why I keep harping on the importance of having a sell stop, just so you can be prepared for that moment in time when this party ends.
Effective today, our domestic “Buy” signal has been confirmed, and we will remain invested, subject to our trailing sell stops.
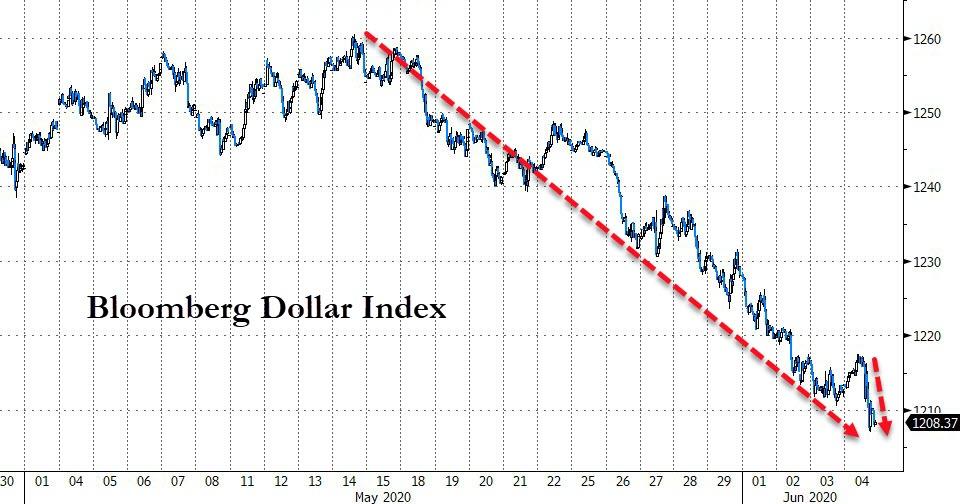
The whipping boy of the last few weeks has been the US Dollar, which has presented us with the biggest 14-day drop since October 2011, according to ZH. Could this be a precursor of an increase in inflationary trends?
Be that as it may, right now we will follow the major trends in the markets, which according to my work shows that we could be in the beginning stages of a new bull run. Could it reverse? Sure, that’s why we have trailing sell stops to help us with managing portfolio risk.
2. ETFs in the Spotlight
In case you missed the announcement and description of this section, you can read it here again.
It features some of the 10 broadly diversified domestic and sector ETFs from my HighVolume list as posted every Saturday. Furthermore, they are screened for the lowest MaxDD% number meaning they have been showing better resistance to temporary sell offs than all others over the past year.
The below table simply demonstrates the magnitude with which these ETFs are fluctuating above or below their respective individual trend lines (%+/-M/A). A break below, represented by a negative number, shows weakness, while a break above, represented by a positive percentage, shows strength.
For hundreds of ETF choices, be sure to reference Thursday’s StatSheet.
For this new domestic “Buy” cycle, which was effective 6/4/2020, here’s how some our candidates have fared:
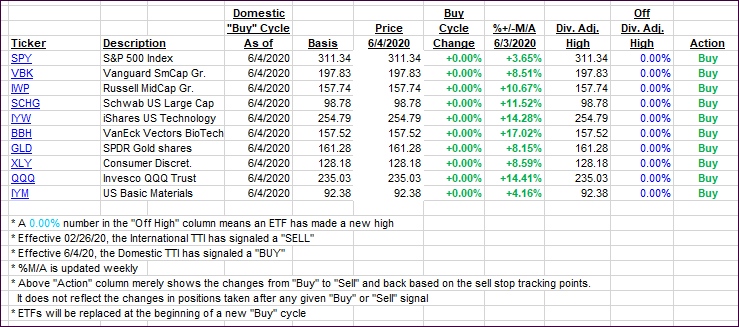
Click image to enlarge
I will update the above after the confirmation of our new 6/4/20 “Buy” signal.
Again, the %+/-M/A column above shows the position of the various ETFs in relation to their respective long-term trend lines, while the trailing sell stops are being tracked in the “Off High” column. The “Action” column will signal a “Sell” once the -8% point has been taken out in the “Off High” column. For more volatile sector ETFs, the trigger point is -10%.
3. Trend Tracking Indexes (TTIs)
Our TTIs improved despite the overall markets treading water.
This is how we closed 06/04/2020:
Domestic TTI: +2.17% above its M/A (prior close +1.65%)—Buy signal effective 06/04/2020
International TTI: -2.49% below its M/A (prior close -2.58%)—Sell signal effective 02/26/2020
Disclosure: I am obliged to inform you that I, as well as my advisory clients, own some of the ETFs listed in the above table. Furthermore, they do not represent a specific investment recommendation for you, they merely show which ETFs from the universe I track are falling within the specified guidelines.
Contact Ulli