
- Moving the markets
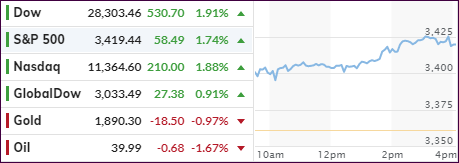
So far, my guess that yesterday’s plunge might have been an outlier looks to be correct, as the markets staged a comeback rally by recouping more than yesterday’s losses.
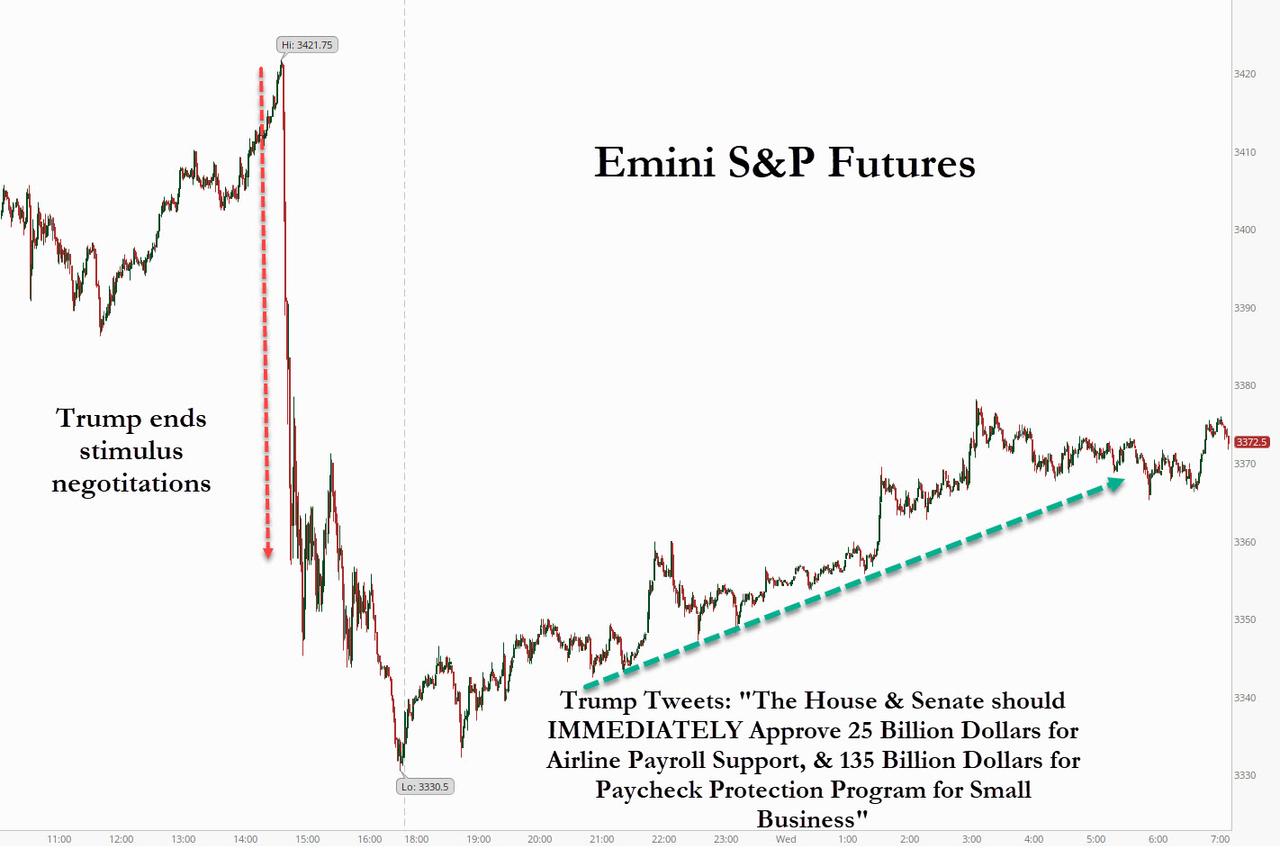
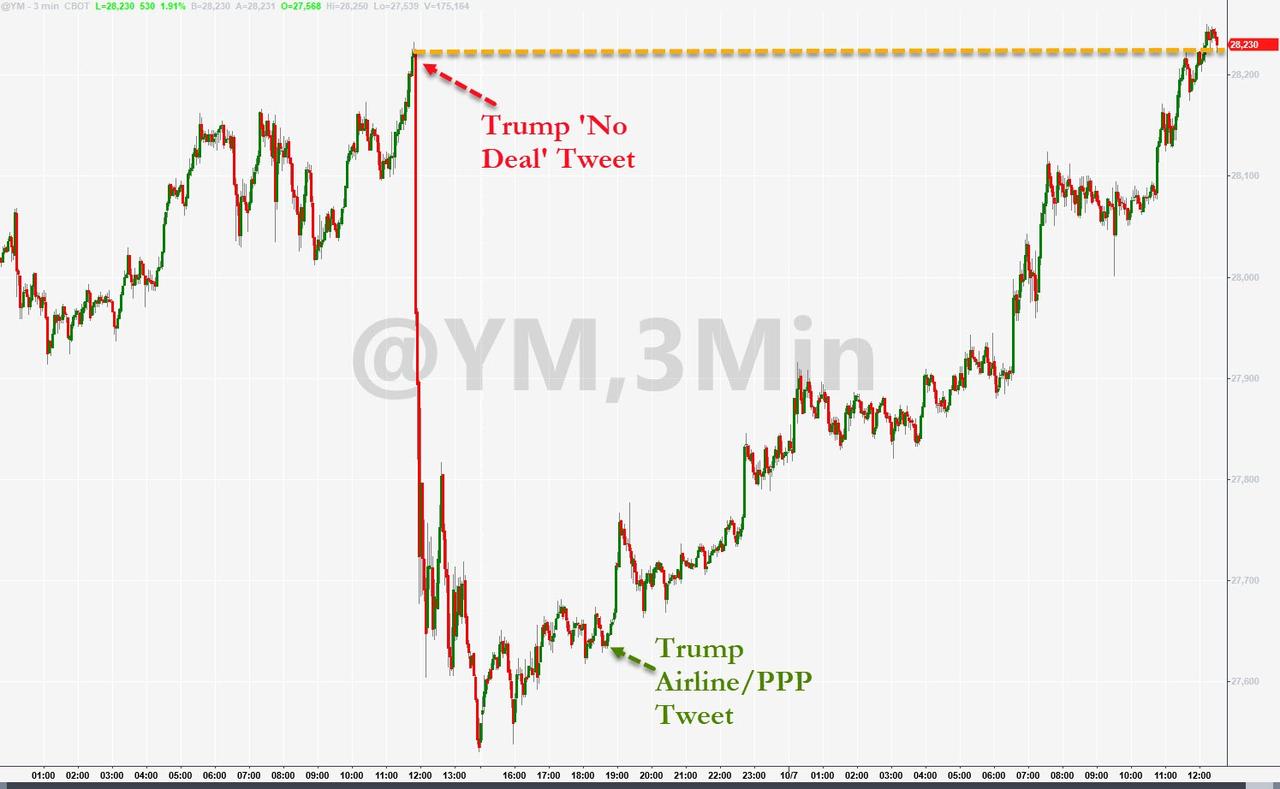
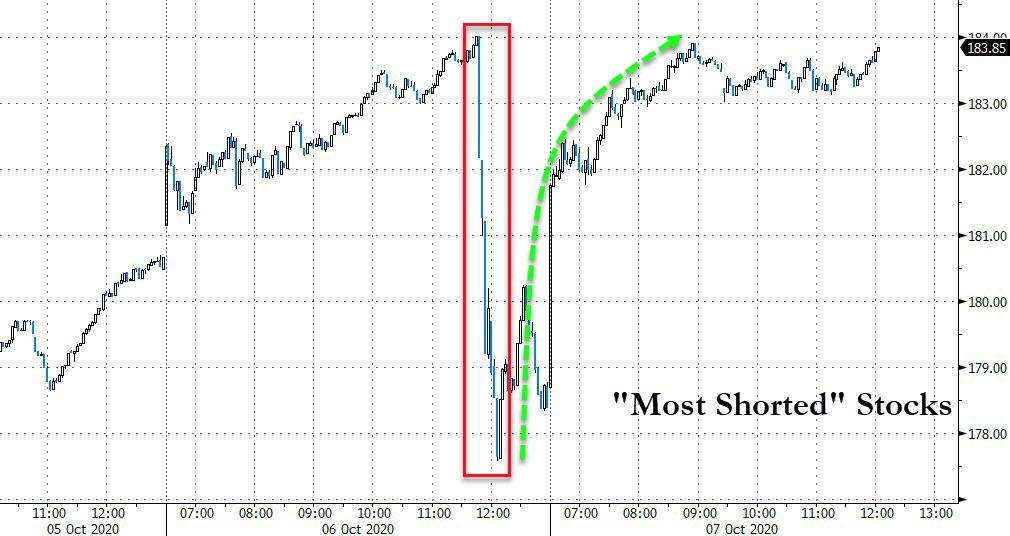
This came in part due to Trump walking back his tough talk by tweeting support for an immediate $25 billion for Airline Payroll package and $135 billion for PPP for Small Business. Hope for a fast passage spread, and the resulting rebound got started in the futures market, as this chart shows.
“This certainly isn’t the first time we’ve seen the market react to Trump tweets, and it probably won’t be the last,” said Chris Larkin, managing director of trading and investment product at E-Trade. “The seesaw we’ve seen since yesterday’s plunge is just case and point for the volatility we may encounter as we close in on the election.”
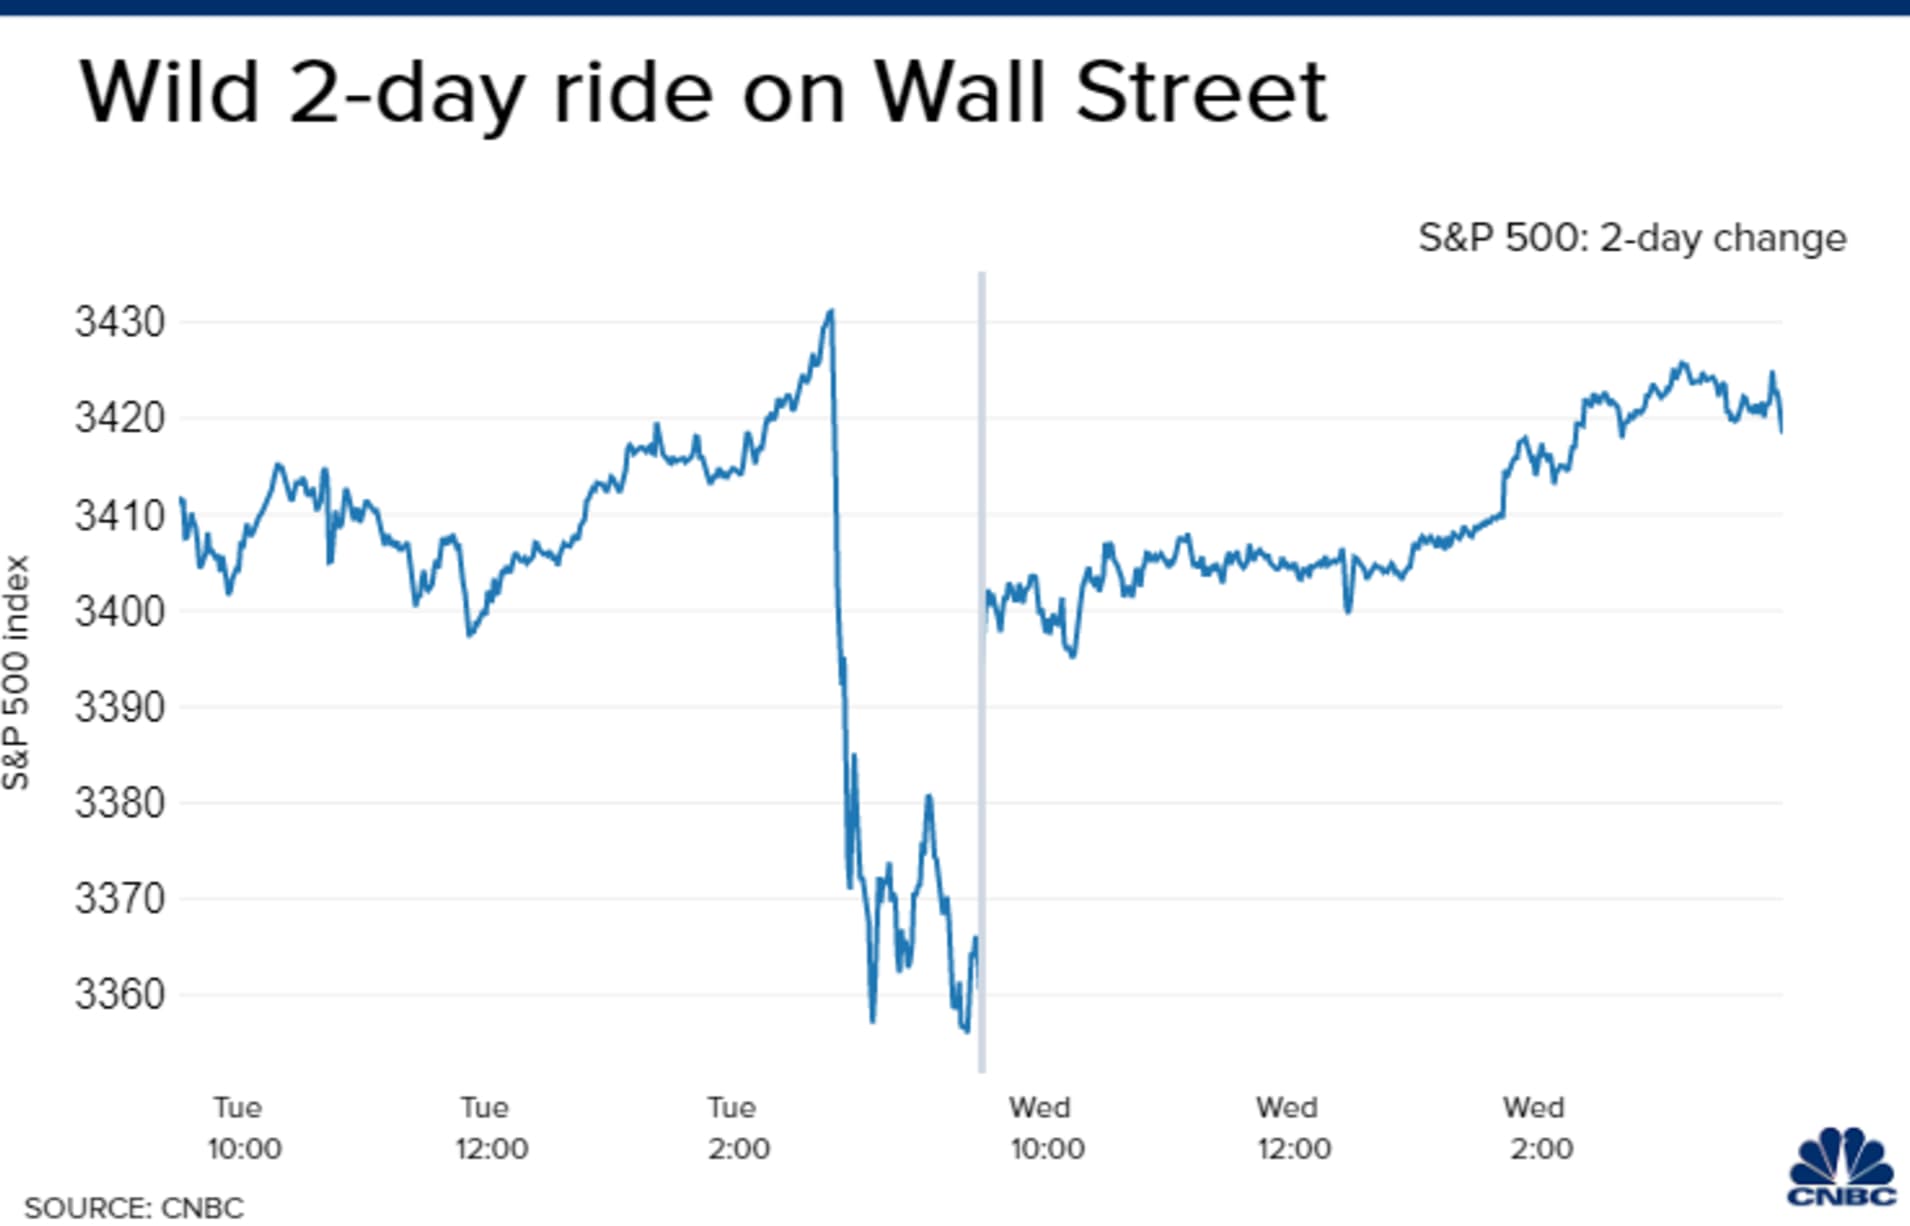
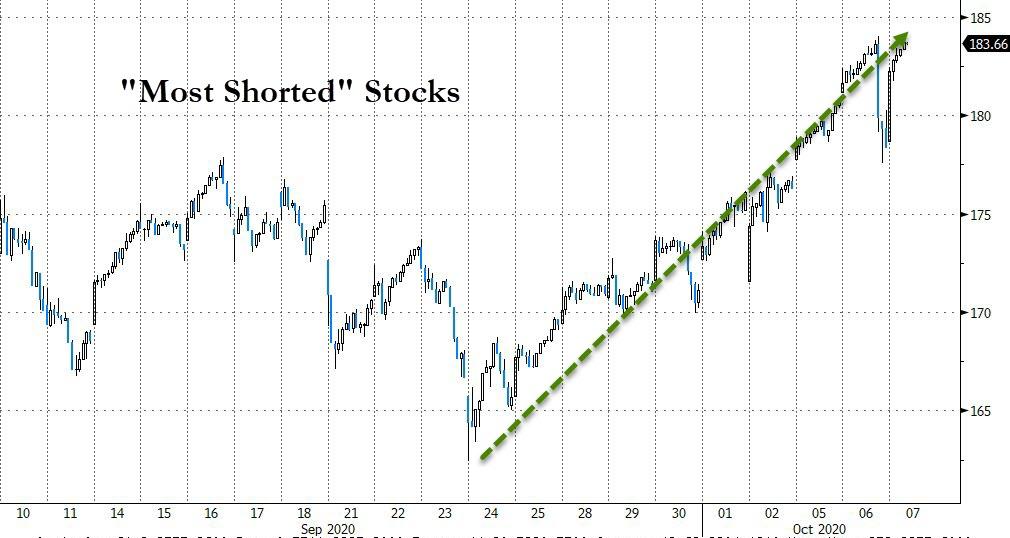
For sure, it’s been a wild ride just the past 2 days, but the S&P 500 got back to yesterday’s highs, as a bit of uncertainty has now been removed. In addition, a massive short squeeze, the 8th in the last 9 days, gave an assist to pull the major indexes out of their doldrums.
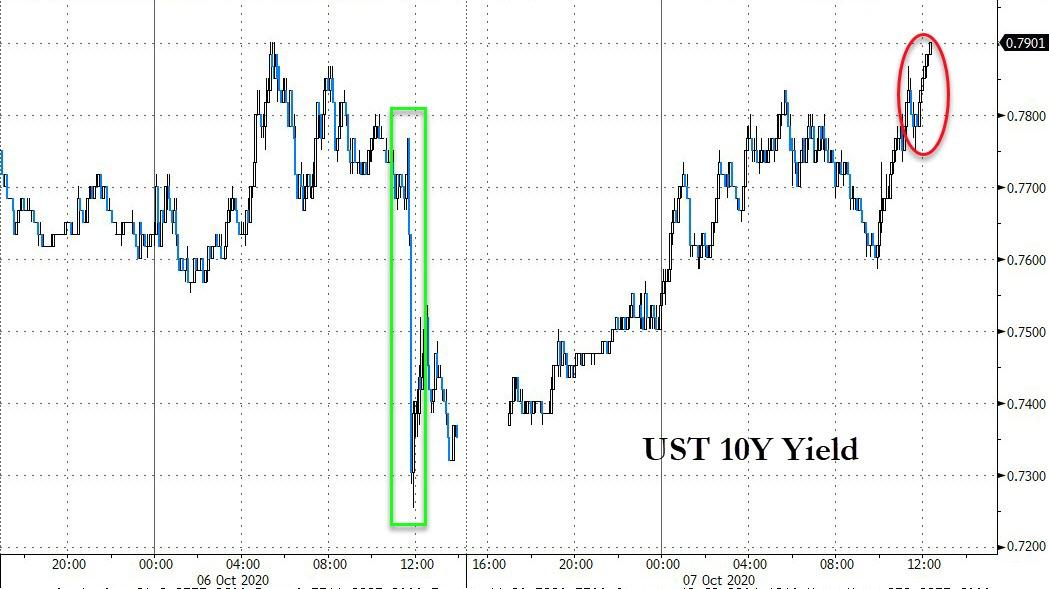
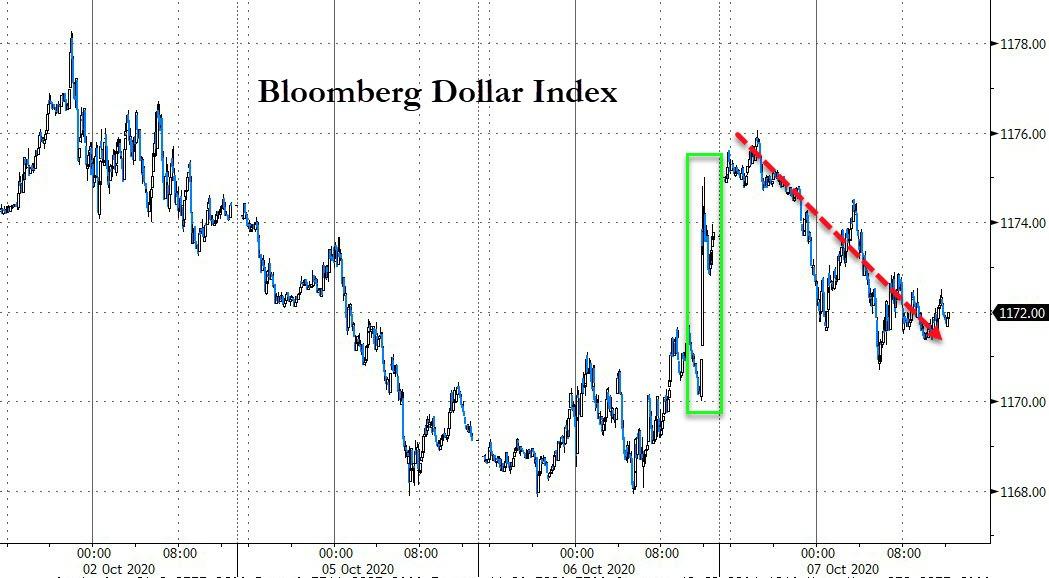
While spot gold tumbled -0.97%, as higher bond yields took their toll, the effect on the GLD ETF was much smaller and resulted in only a -0.05% loss, as the slumping US Dollar lent a helping hand.
The FOMC minutes released by the Fed had no effect on the markets.
2. ETFs in the Spotlight
In case you missed the announcement and description of this section, you can read it here again.
It features some of the 10 broadly diversified domestic and sector ETFs from my HighVolume list as posted every Saturday. Furthermore, they are screened for the lowest MaxDD% number meaning they have been showing better resistance to temporary sell offs than all others over the past year.
The below table simply demonstrates the magnitude with which these ETFs are fluctuating above or below their respective individual trend lines (%+/-M/A). A break below, represented by a negative number, shows weakness, while a break above, represented by a positive percentage, shows strength.
For hundreds of ETF choices, be sure to reference Thursday’s StatSheet.
For this current domestic “Buy” cycle, here’s how some our candidates have fared:
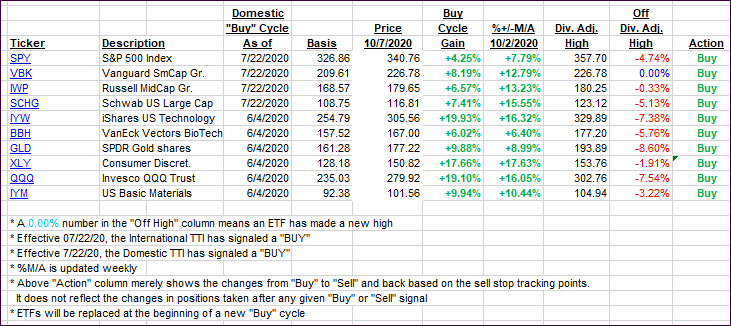
Click image to enlarge
Again, the %+/-M/A column above shows the position of the various ETFs in relation to their respective long-term trend lines, while the trailing sell stops are being tracked in the “Off High” column. The “Action” column will signal a “Sell” once the -8% point has been taken out in the “Off High” column. For more volatile sector ETFs, the trigger point is -10%.
3. Trend Tracking Indexes (TTIs)
Our TTIs roared back after yesterday’s set back.
This is how we closed 10/07/2020:
Domestic TTI: +9.17% above its M/A (prior close +7.22%)—Buy signal effective 07/22/2020
International TTI: +5.55% above its M/A (prior close +4.41%)—Buy signal effective 07/22/2020
Disclosure: I am obliged to inform you that I, as well as my advisory clients, own some of the ETFs listed in the above table. Furthermore, they do not represent a specific investment recommendation for you, they merely show which ETFs from the universe I track are falling within the specified guidelines.
Contact Ulli