
- Moving the markets
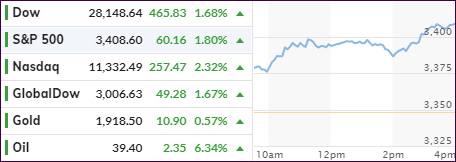
After the markets ended last week with a whimper, there was none of that left today, as the major indexes jumped out of the gate, never looked back, and shifted into overdrive during the last hour.
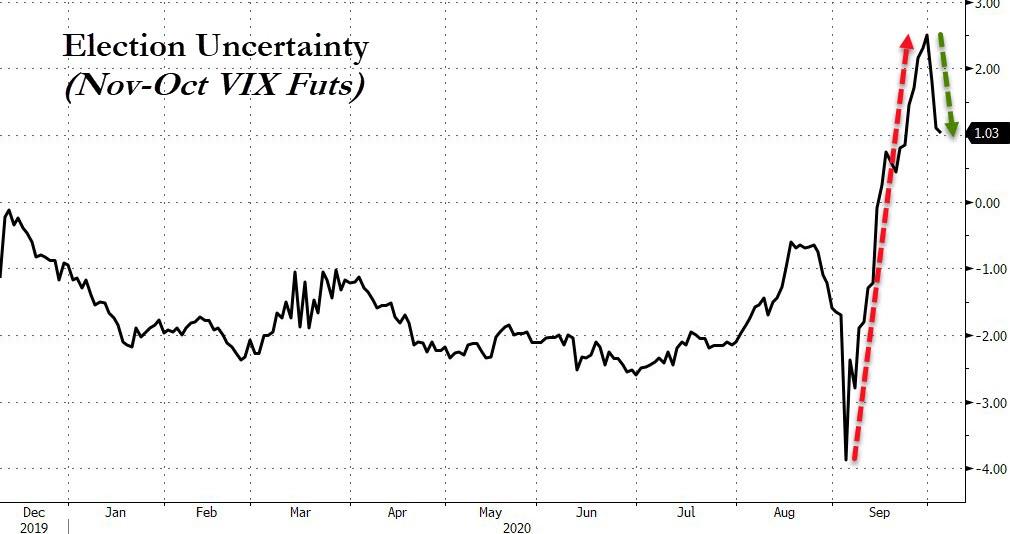
The result was a solid and broad advance supported by various news headlines. One was the announcement that President Trump would be released from the hospital tonight, which eased concerns about election worries.
The other came from the on-off stimulus negotiations with traders growing hopeful that lawmakers can reach a compromise deal—soon. The importance of that was highlighted by Friday’s jobs report, which showed decent numbers but well below expectations.
House Speaker Nancy Pelosi and Treasury Secretary Steven Mnuchin held an hourlong phone call Monday and discussed “the justifications for various numbers” and “plan to exchange paper” in preparation for further discussions on Tuesday, Pelosi’s chief of staff said.
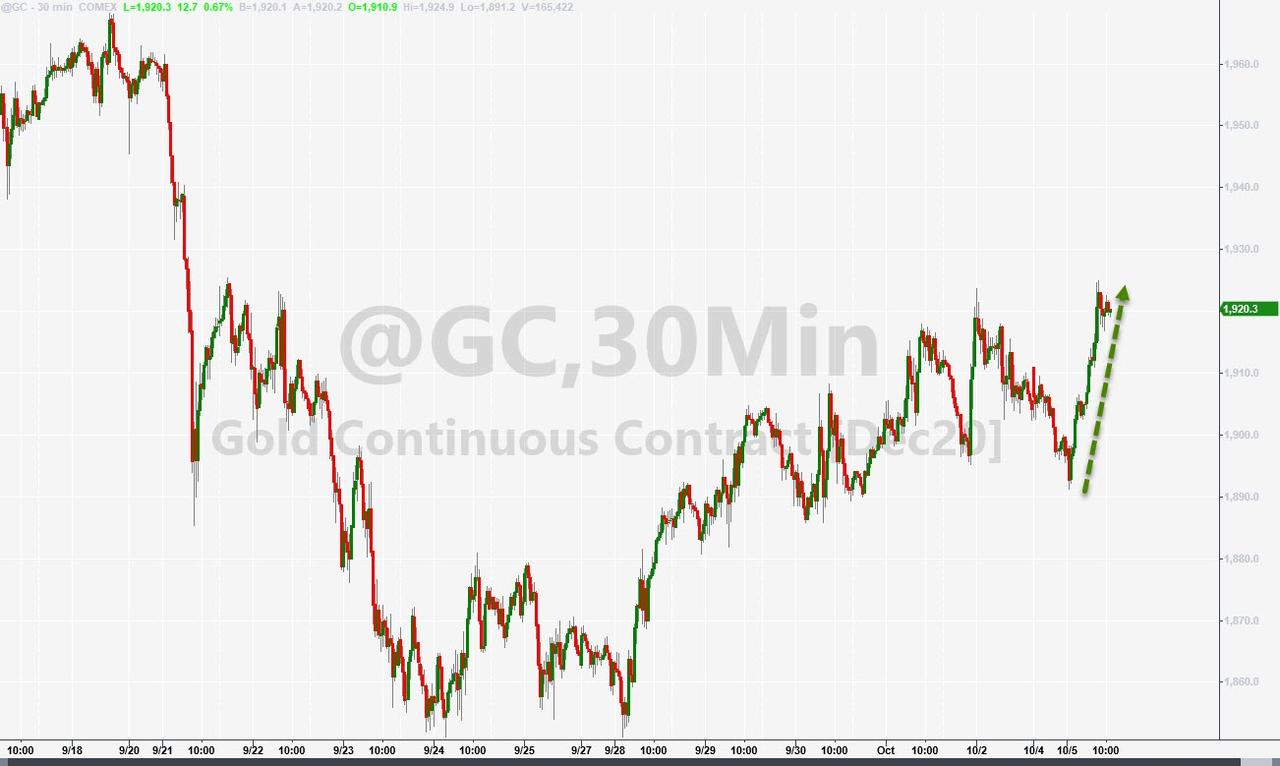
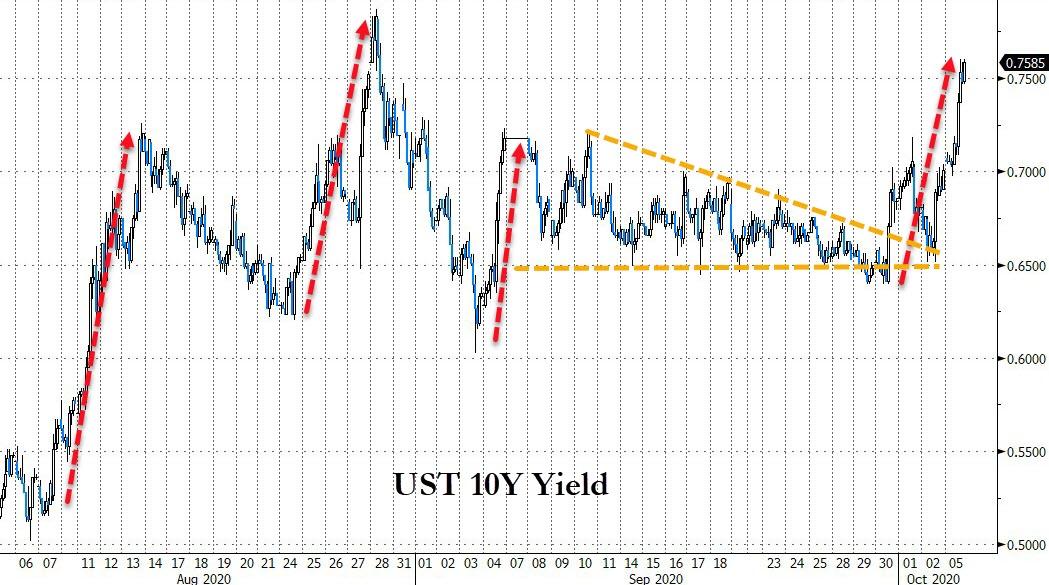
At least for today, election uncertainty took a backseat, as not only stocks jumped but gold as well, while the dollar tanked along with bonds, due to rising yields.
This week looks to be a quiet one, besides the VP debate on Wednesday night, but there will be FED and ECB meetings and subsequent announcements, any of which could be market moving events.
2. ETFs in the Spotlight
In case you missed the announcement and description of this section, you can read it here again.
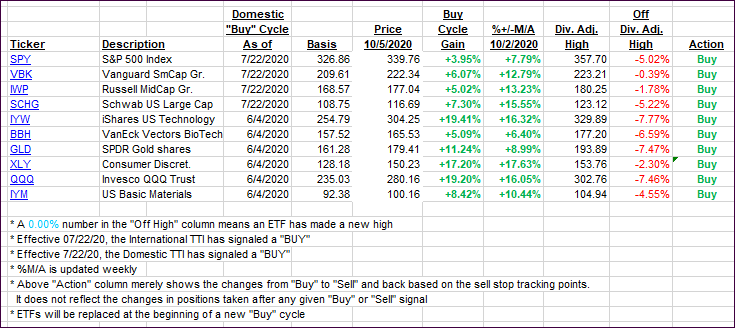
It features some of the 10 broadly diversified domestic and sector ETFs from my HighVolume list as posted every Saturday. Furthermore, they are screened for the lowest MaxDD% number meaning they have been showing better resistance to temporary sell offs than all others over the past year.
The below table simply demonstrates the magnitude with which these ETFs are fluctuating above or below their respective individual trend lines (%+/-M/A). A break below, represented by a negative number, shows weakness, while a break above, represented by a positive percentage, shows strength.
For hundreds of ETF choices, be sure to reference Thursday’s StatSheet.
For this current domestic “Buy” cycle, here’s how some our candidates have fared:
Click image to enlarge
Again, the %+/-M/A column above shows the position of the various ETFs in relation to their respective long-term trend lines, while the trailing sell stops are being tracked in the “Off High” column. The “Action” column will signal a “Sell” once the -8% point has been taken out in the “Off High” column. For more volatile sector ETFs, the trigger point is -10%.
3. Trend Tracking Indexes (TTIs)
Our TTIs jumped as this week started out with a bang.
This is how we closed 10/05/2020:
Domestic TTI: +8.33% above its M/A (prior close +6.47%)—Buy signal effective 07/22/2020
International TTI: +4.61% above its M/A (prior close +2.89%)—Buy signal effective 07/22/2020
Disclosure: I am obliged to inform you that I, as well as my advisory clients, own some of the ETFs listed in the above table. Furthermore, they do not represent a specific investment recommendation for you, they merely show which ETFs from the universe I track are falling within the specified guidelines.
Contact Ulli