
- Moving the markets
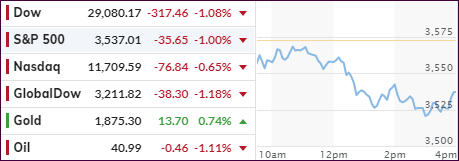
The futures market already indicated that volatility was on its way, with the indexes slipping around 1%, then trimming their losses and vacillating around their respective unchanged lines.
Moving into the regular session, the Dow and S&P 500 never saw the light of day and stumbled around in negative territory, then losing footing fast as selling accelerated late in the day before rebounding into the close. The Nasdaq fared much better and held onto gains till about mid-day, after which the bearish forces proved too strong, and the index capitulated as well.
The bearer of bad news was reports showing increasing numbers of U.S. coronavirus cases, which brought concerns back to the front burner that the nascent economic recovery may not be as solid as assumed, especially in view of recent new lockdown orders. As a result, the S&P barely remains above Friday’s closing level, which means much of the “vaccine rally” has been given back.
Further sapping bullish strength were Fed head Powell’s remarks that the economic outlook remained uncertain despite the positive vaccine news story.
“From our standpoint, it’s just too soon to assess with any confidence the implications of the news for the path of the economy, especially in the near term,” Powell said regarding the vaccine. “With the virus spreading, the next few months could be challenging.”
Also keeping the bulls in check were WH statements, which greatly diminished the chances of a trillion-dollar or more stimulus for the economy before January, but Dems and Reps are still talking.
Moving into bullish mode was gold, which managed to stage a modest rally thereby offsetting most of the equity losses.
2. ETFs in the Spotlight
In case you missed the announcement and description of this section, you can read it here again.
It features some of the 10 broadly diversified domestic and sector ETFs from my HighVolume list as posted every Saturday. Furthermore, they are screened for the lowest MaxDD% number meaning they have been showing better resistance to temporary sell offs than all others over the past year.
The below table simply demonstrates the magnitude with which these ETFs are fluctuating above or below their respective individual trend lines (%+/-M/A). A break below, represented by a negative number, shows weakness, while a break above, represented by a positive percentage, shows strength.
For hundreds of ETF choices, be sure to reference Thursday’s StatSheet.
For this current domestic “Buy” cycle, here’s how some our candidates have fared:
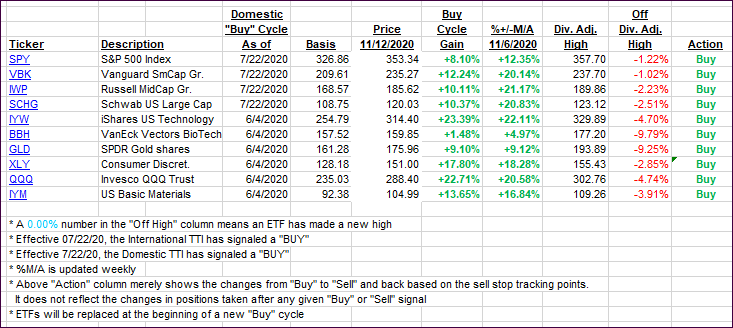
Click image to enlarge
Again, the %+/-M/A column above shows the position of the various ETFs in relation to their respective long-term trend lines, while the trailing sell stops are being tracked in the “Off High” column. The “Action” column will signal a “Sell” once the -8% point has been taken out in the “Off High” column. For more volatile sector ETFs, the trigger point is -10%.
3. Trend Tracking Indexes (TTIs)
Our TTIs came off their highs, as the “vaccine rally” lost some of its luster.
This is how we closed 11/12/2020:
Domestic TTI: +14.98% above its M/A (prior close +16.80%)—Buy signal effective 07/22/2020
International TTI: +12.83% above its M/A (prior close +14.28%)—Buy signal effective 07/22/2020
Disclosure: I am obliged to inform you that I, as well as my advisory clients, own some of the ETFs listed in the above table. Furthermore, they do not represent a specific investment recommendation for you, they merely show which ETFs from the universe I track are falling within the specified guidelines.
Contact Ulli