
- Moving the markets
In the futures markets, we saw stocks in rally mode, including the Nasdaq staging a comeback. The US dollar inched higher, thereby keeping a lid on gold’s attempts to rebound.
The tug-of-war between surging infections and prospects for a new effective Covid-19 vaccine had the latter coming out ahead by lending support to equities, which carried over into the regular session.
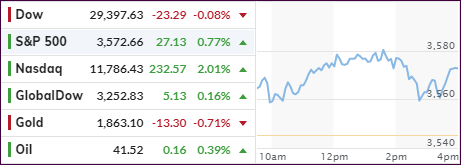
After taking a beating over the last few trading days, dip buyers stepped in and pushed the Nasdaq up over 2%, with the S&P 500 placing a distant second place, while the Dow slipped slightly into the red after strong back-to-back sessions.
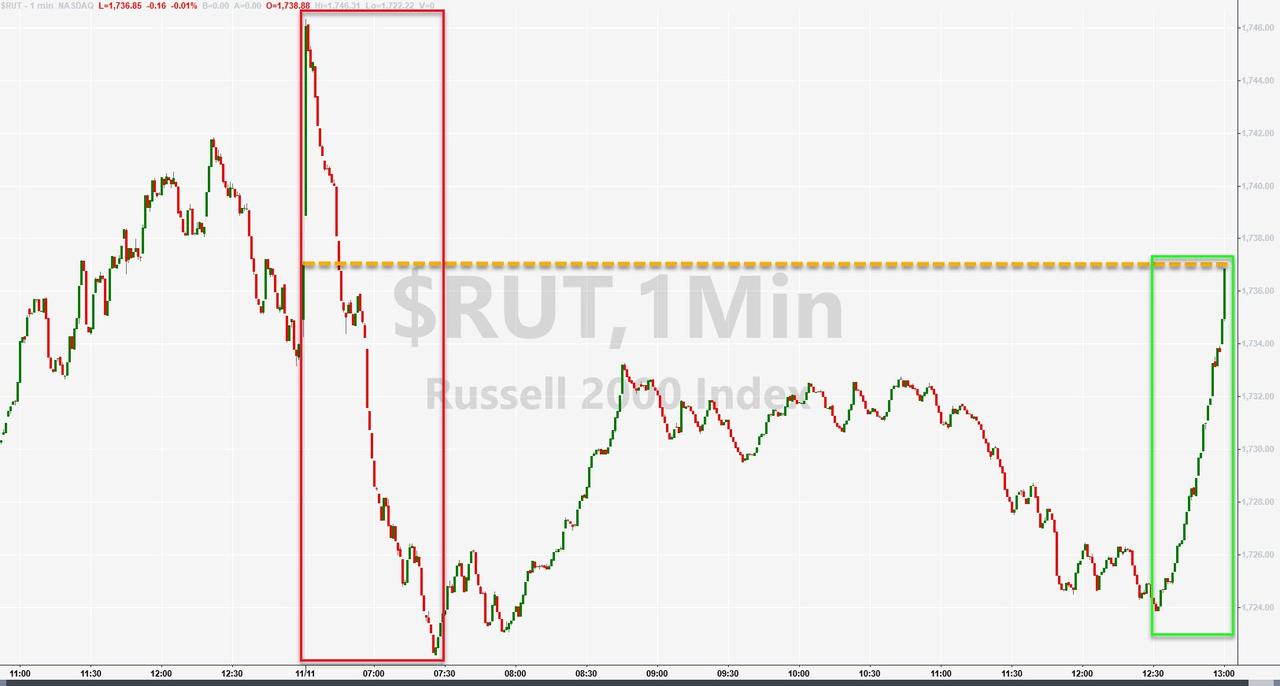
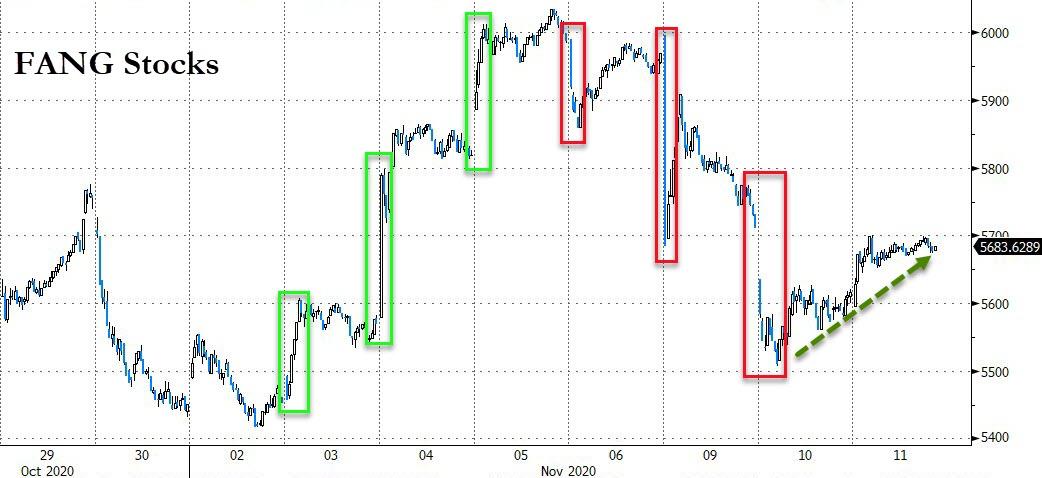
The bond market was closed due to Veteran’s Day, which prompted a reversal from value back to growth, as small caps suffered but were able to climb back to the unchanged line. As the Nasdaq recovered, so the did the FANG stocks, as Bloomberg shows in this chart.
Cycling back to the Coronavirus, Bloomberg’s latest update shows that, while confirmed cases are rising, the hospitalization rate is vacillating but not storming higher, and the confirmed deaths have not increased:
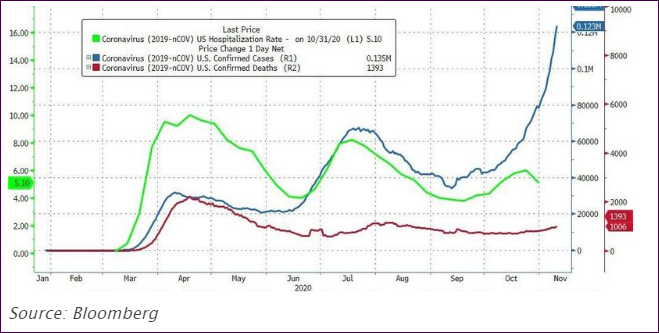
You can draw your own conclusions.
Continue reading…
2. ETFs in the Spotlight
In case you missed the announcement and description of this section, you can read it here again.
It features some of the 10 broadly diversified domestic and sector ETFs from my HighVolume list as posted every Saturday. Furthermore, they are screened for the lowest MaxDD% number meaning they have been showing better resistance to temporary sell offs than all others over the past year.
The below table simply demonstrates the magnitude with which these ETFs are fluctuating above or below their respective individual trend lines (%+/-M/A). A break below, represented by a negative number, shows weakness, while a break above, represented by a positive percentage, shows strength.
For hundreds of ETF choices, be sure to reference Thursday’s StatSheet.
For this current domestic “Buy” cycle, here’s how some our candidates have fared:
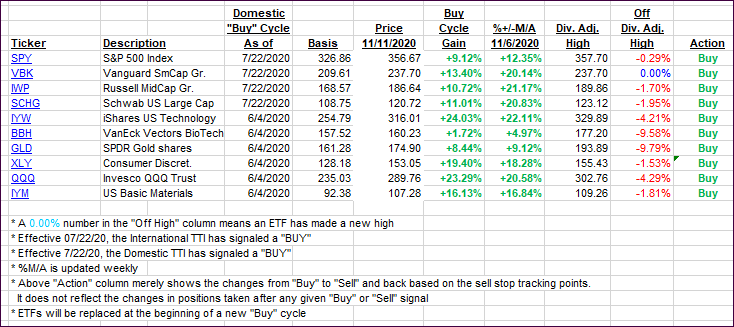
Click image to enlarge
Again, the %+/-M/A column above shows the position of the various ETFs in relation to their respective long-term trend lines, while the trailing sell stops are being tracked in the “Off High” column. The “Action” column will signal a “Sell” once the -8% point has been taken out in the “Off High” column. For more volatile sector ETFs, the trigger point is -10%.
3. Trend Tracking Indexes (TTIs)
Our TTIs barely changed as big tech dominated today’s session.
This is how we closed 11/11/2020:
Domestic TTI: +16.80% above its M/A (prior close +17.01%)—Buy signal effective 07/22/2020
International TTI: +14.28% above its M/A (prior close +14.06%)—Buy signal effective 07/22/2020
Disclosure: I am obliged to inform you that I, as well as my advisory clients, own some of the ETFs listed in the above table. Furthermore, they do not represent a specific investment recommendation for you, they merely show which ETFs from the universe I track are falling within the specified guidelines.
Contact Ulli