Riding The Bullish Range

Ulli Market Commentary Contact

[Chart courtesy of MarketWatch.com]

  1. Moving the markets

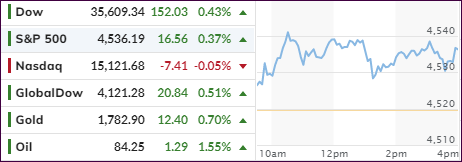
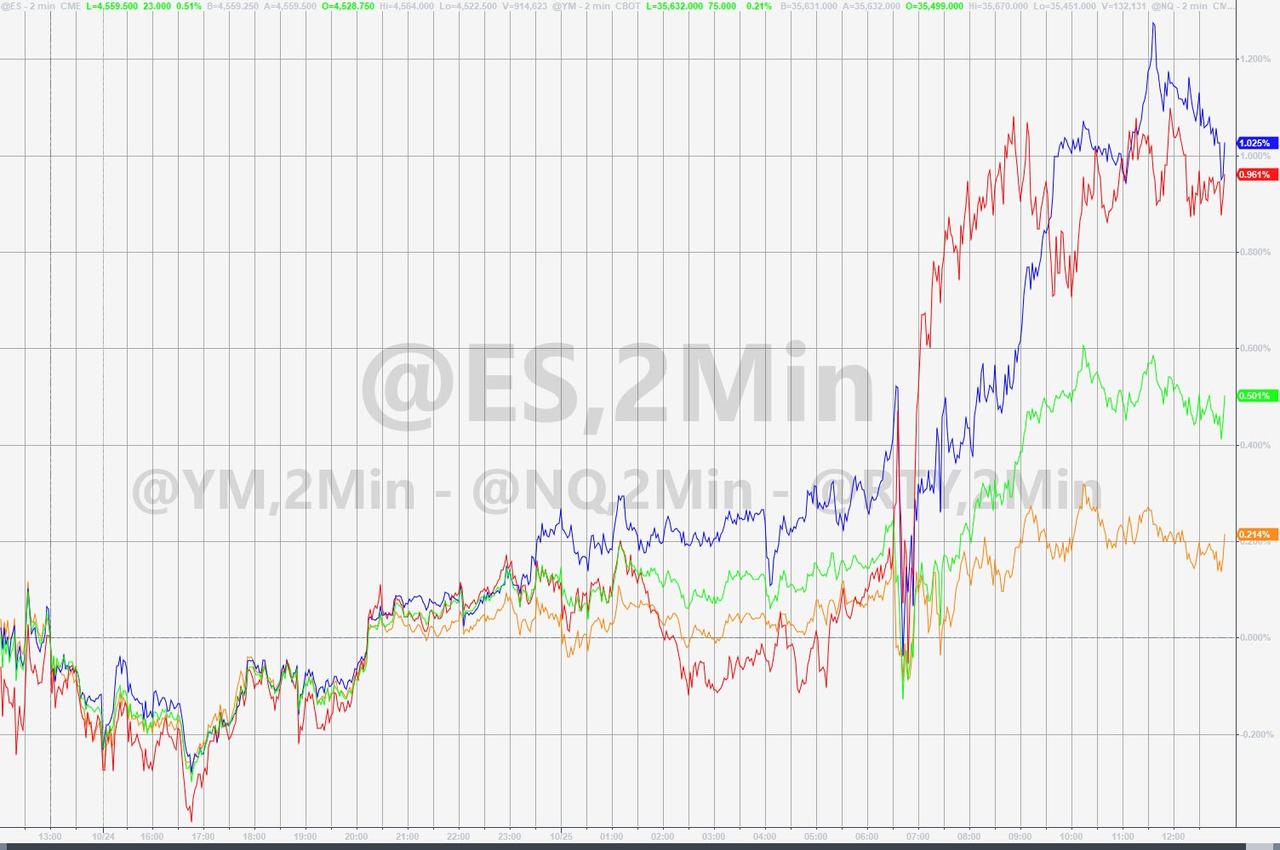
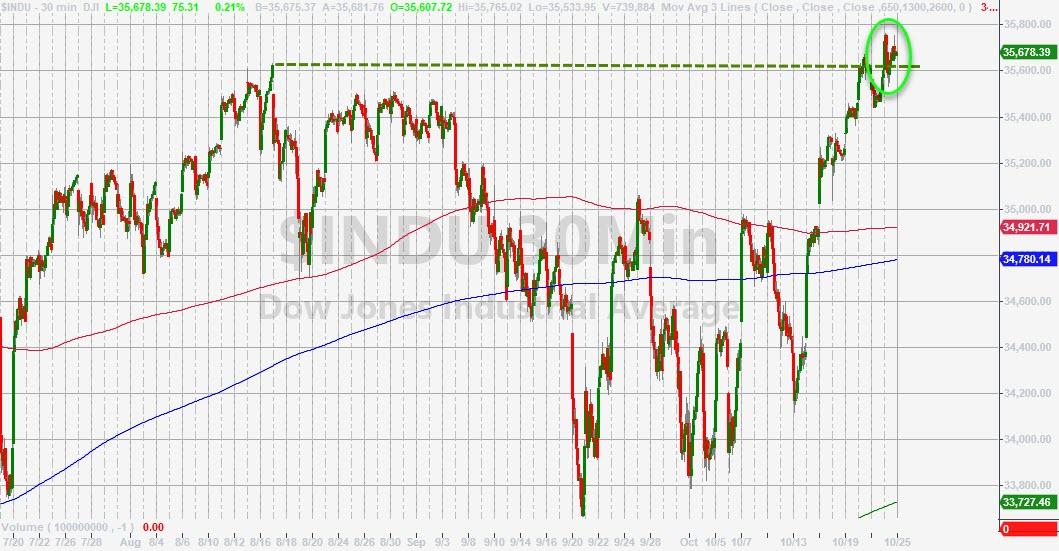
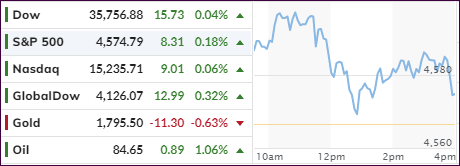
Earnings were the driver that elevated the major indexes to another green close, despite the whipsaws we saw throughout the session. A selloff during the last 30 minutes cut down the unrealized gains but kept the Dow’s record setting 3-day run intact.

Volatility was part of today’s sentiment with MarketWatch describing it this way:

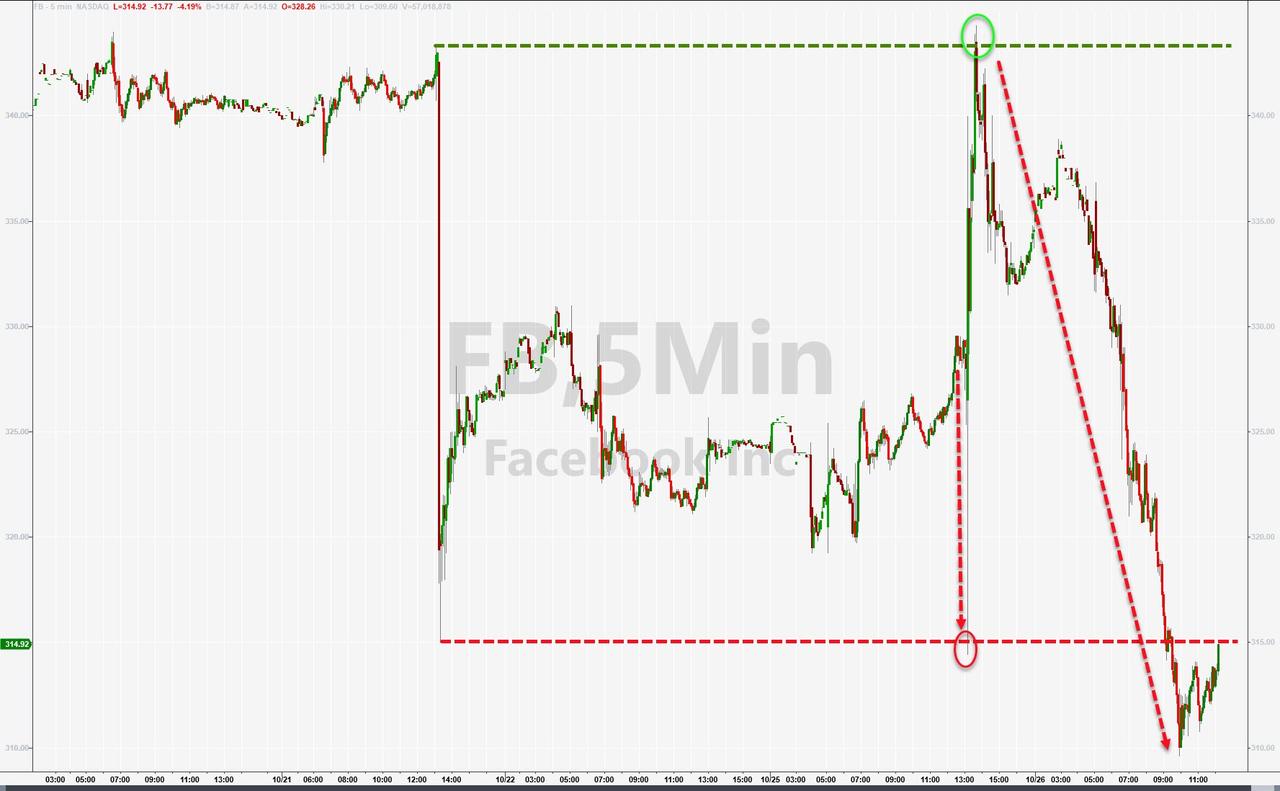
An intraday reversal in shares of Facebook weighed on major averages at midday. After trading flat to higher to start the session Facebook shares dropped more than 5%. The company topped analysts’ earnings expectations but missed estimates for revenue and monthly active users.

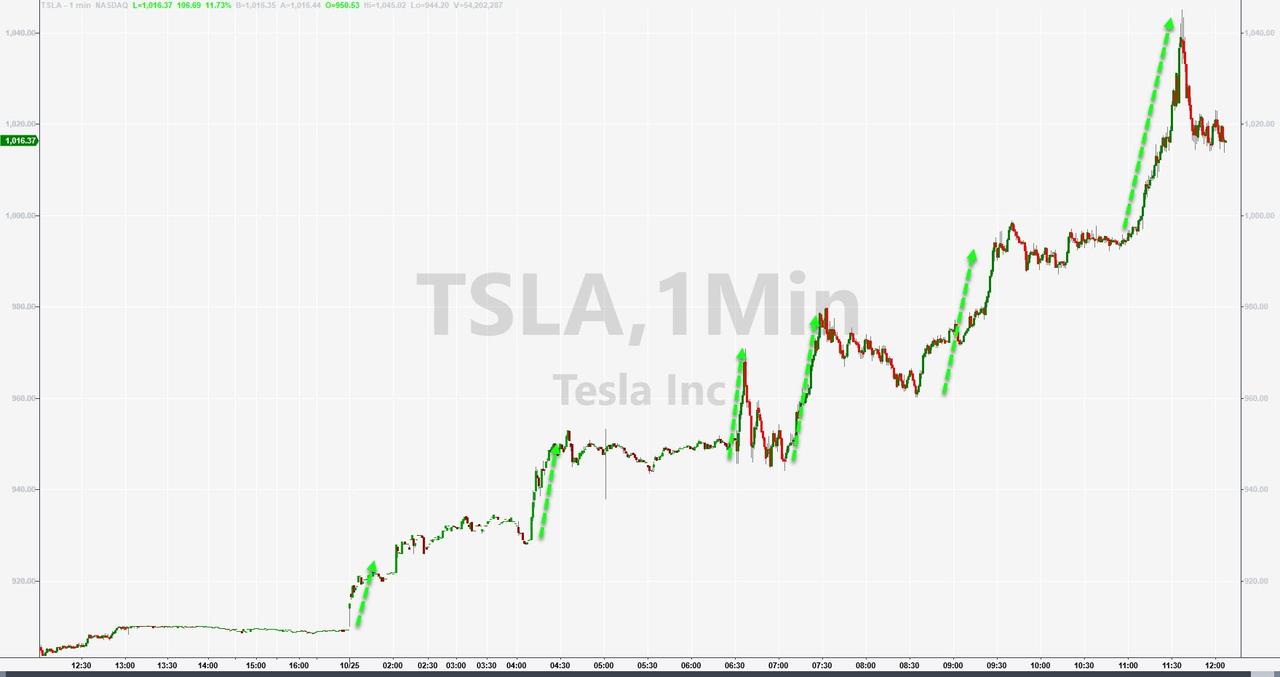
A host of companies, among them UPS, GE, showed improved earnings and guidance, which helped their shares jump, while Tesla, on no news, first added another 5%, then gave it up. However, after rocketing 12% in the previous session, it solidified its market cap over $1 trillion.

On deck, after the close today, are tech heavyweights Alphabet and Microsoft, which ramped higher into the close on high expectations of their reports. Analysts are pondering whether the big names will be able to step up and continue this great start to this earnings season.

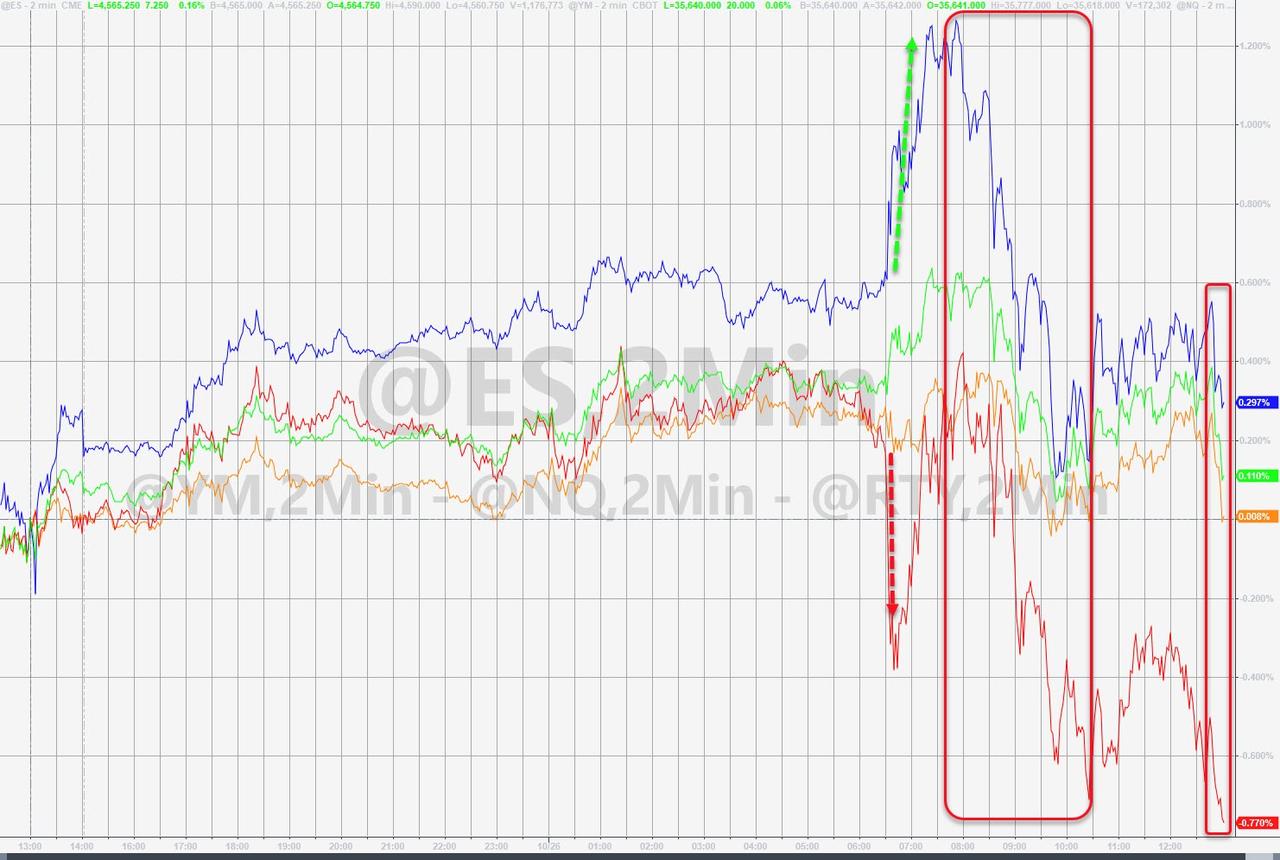
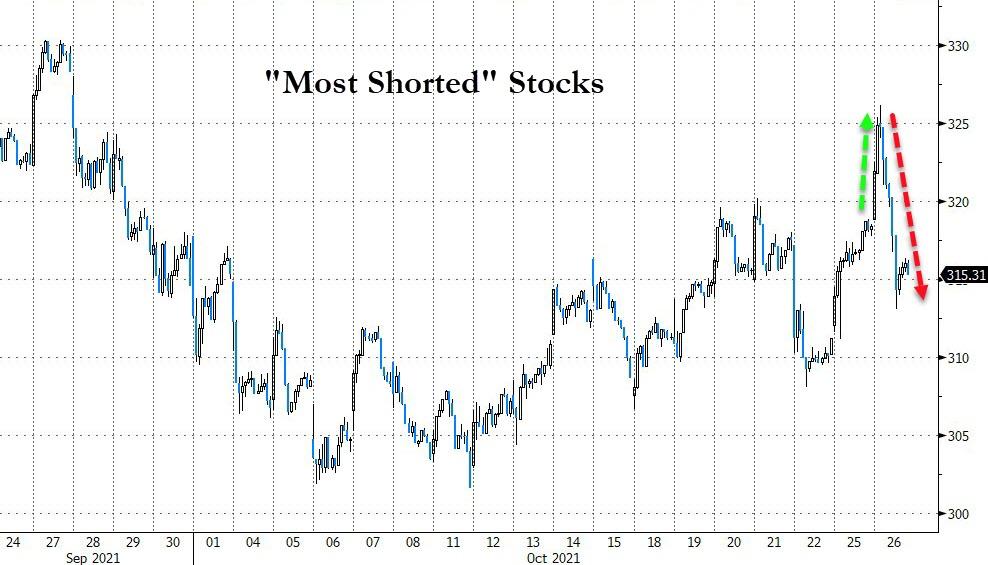
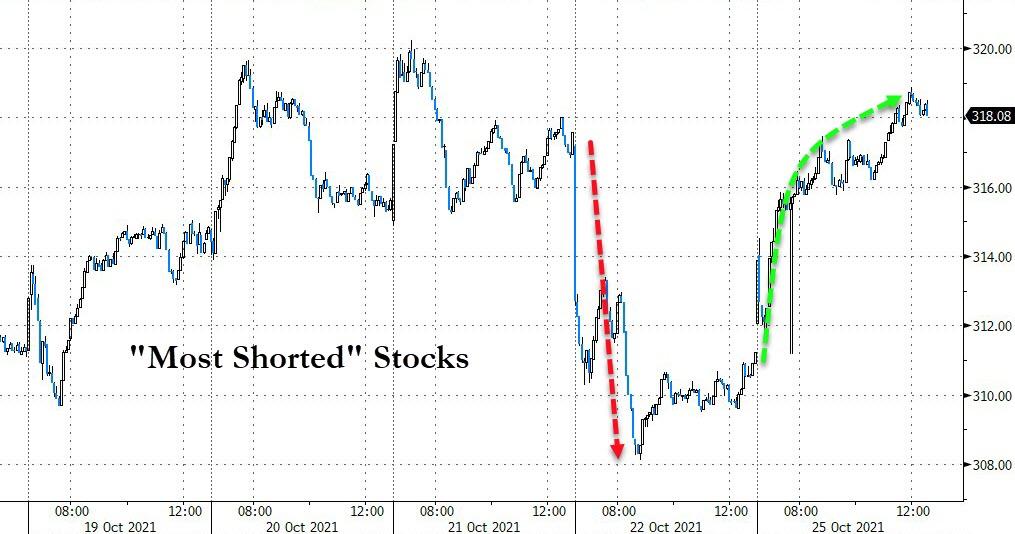
Today’s roller coaster ride was widely spread with Facebook doing a faceplant, following the China Index, which lost 4% today, and the most shorted stocks which, after an early bounce simply did what shorted stocks are supposed to do, namely go down.

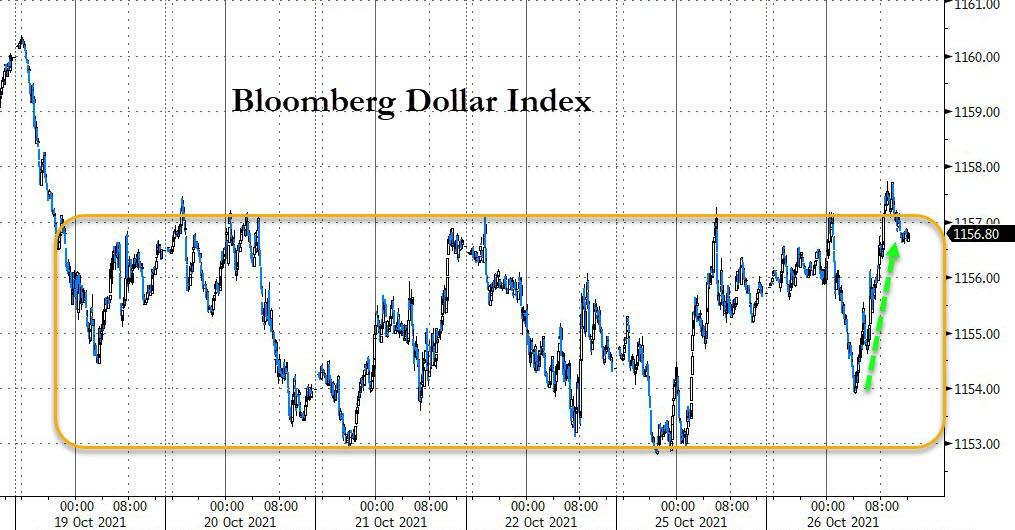
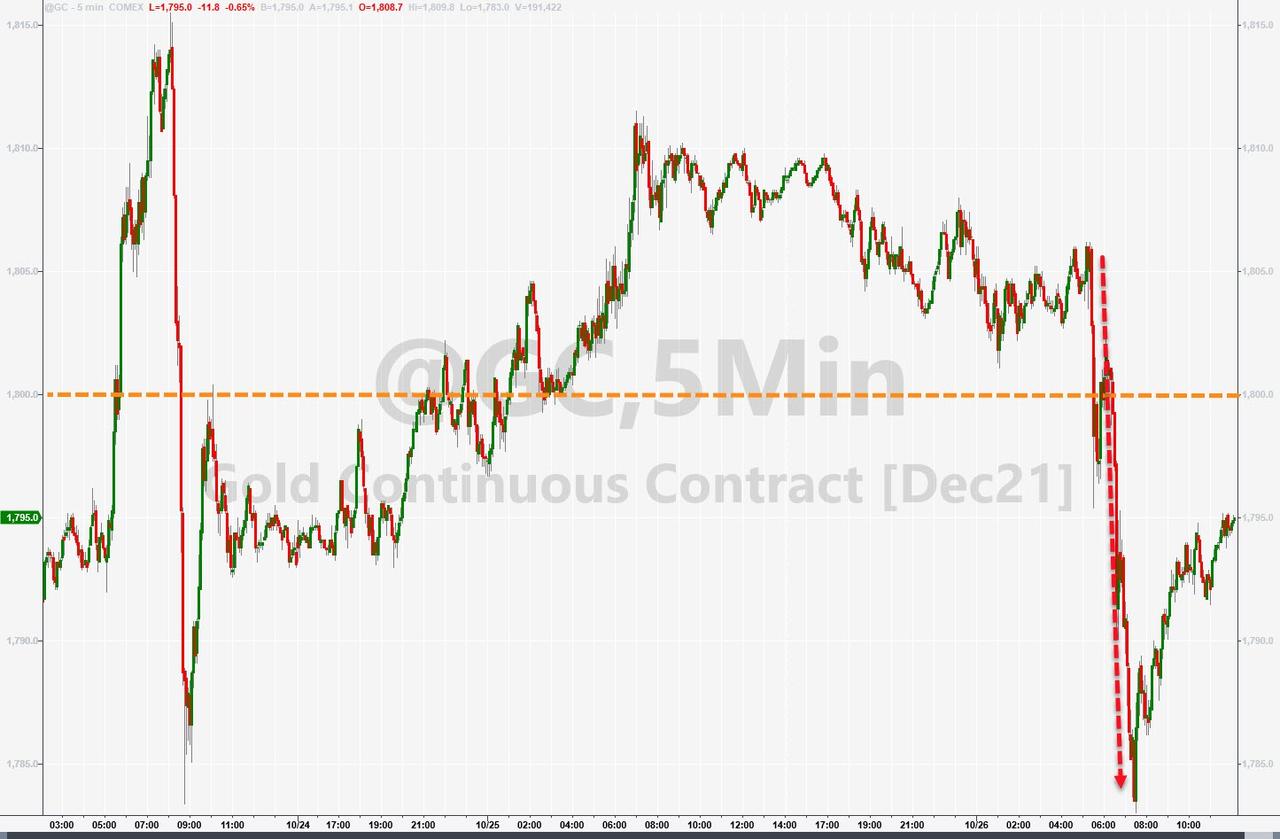
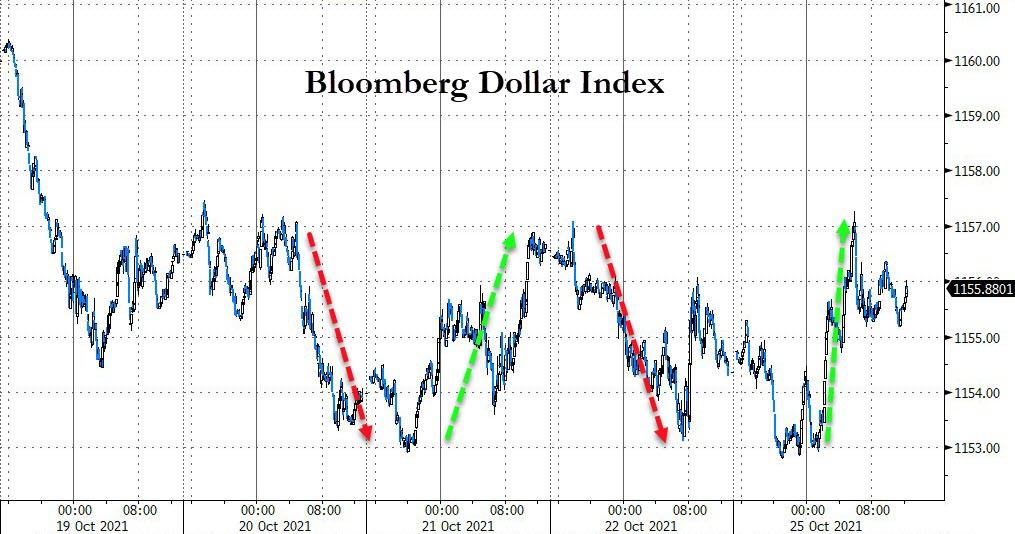
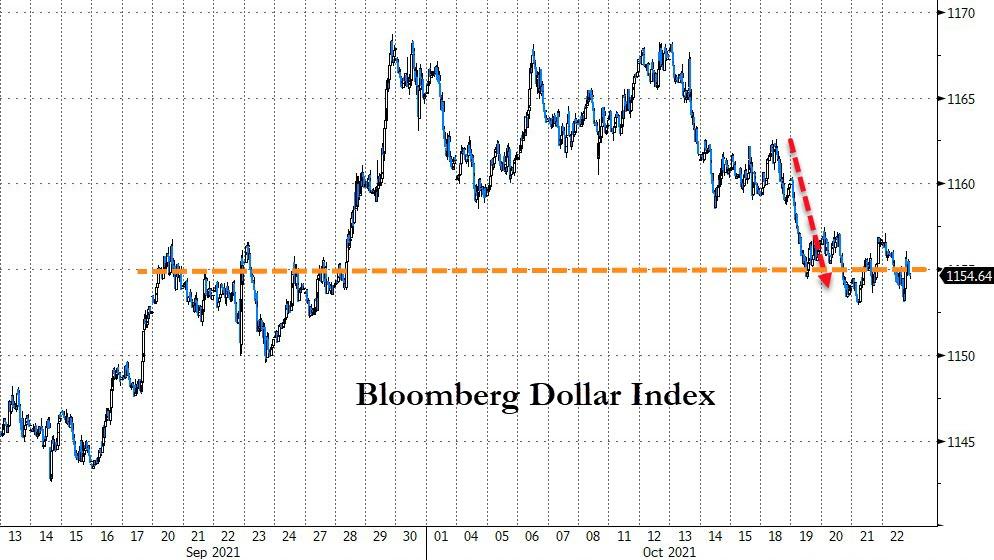
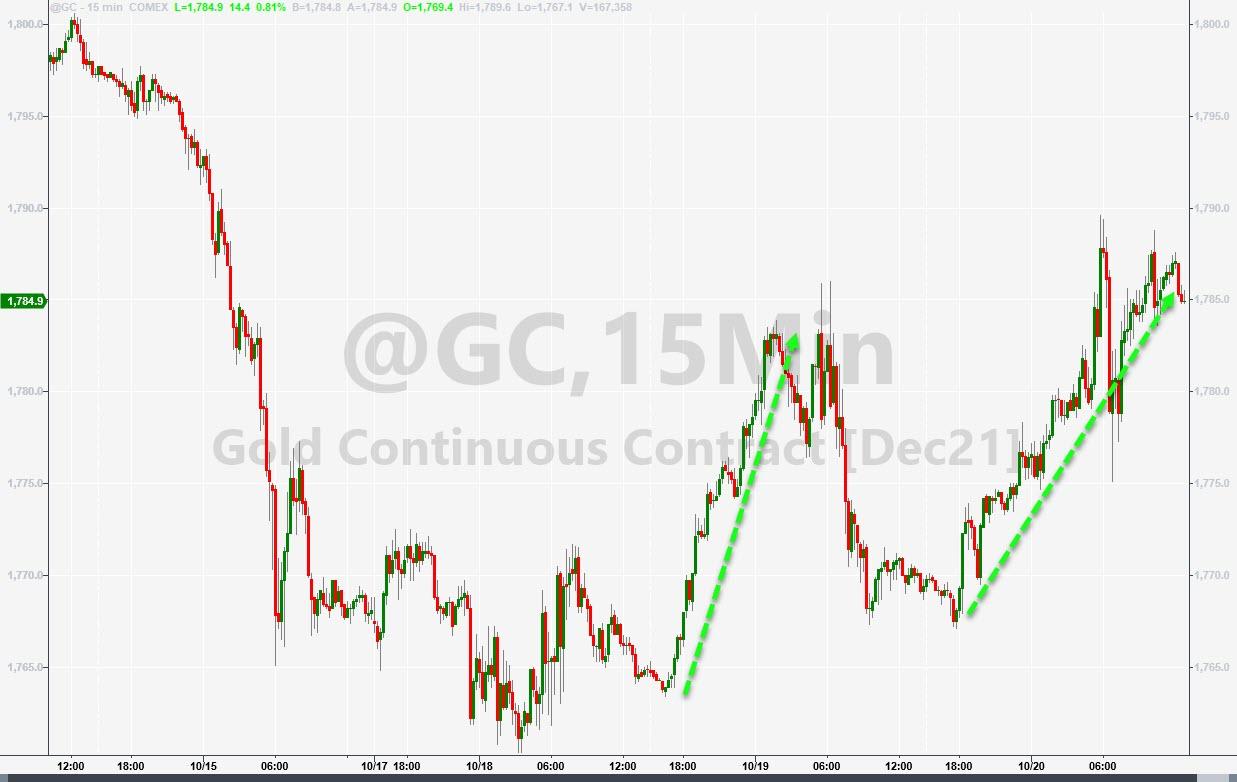
Not to be outdone, the US Dollar dumped and pumped and ended marginally higher, but stayed in its week-long trading range. Gold was not able to withstand all that volatility and gave up its hard-fought gains and its $1,800 level, despite slipping bond yields.

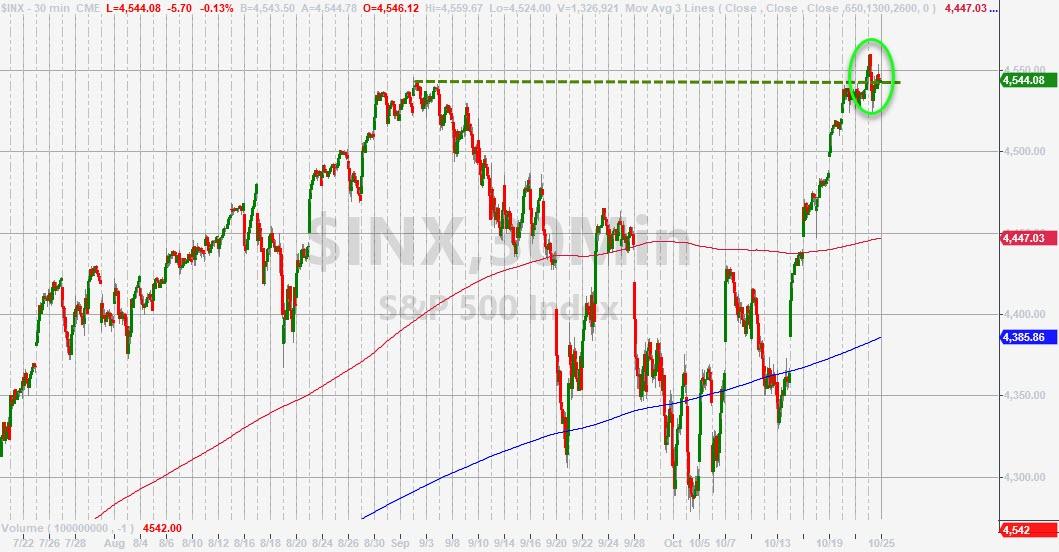
It looked to have been a shakeout kind of session, which is a common theme considering the major indexes are nibbling at their all-time highs.  

Read More
Bulls Remain In Charge

Ulli Market Commentary Contact

[Chart courtesy of MarketWatch.com]

  1. Moving the markets

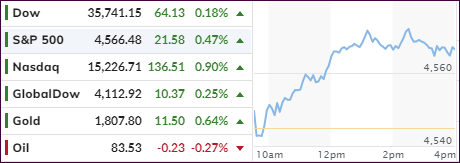
The bulls dominated again and managed to score another winning session and, in the process, pushed the Dow and S&P 500 to new intra-day highs. This move came ahead of a major week of earnings from the big tech heavyweights in anticipation of positive surprises. As a result, the Nasdaq lead the pack with a gain of +0.90%.

Tesla was on fire today with the stock gaining more than 9% and pushing the market cap to over $1 trillion, a move that was supported by Morgan Stanley hiking its price target from $900 to $1,200. Also lending an assist was rental car company Hertz’s announcement that it would order 100k Tesla vehicles.

And as very often is the case, a well-timed short squeeze added support to the bullish theme thereby insuring a green close all the way around.

The US Dollar first dumped and then pumped to close modestly higher, thereby keeping its recent zig-zag pattern intact. Bond yields bounced below and above their respective unchanged lines and hugged them into the close.

As a result of only immaterial movements in the dollar and bond yields, gold continued its march higher by not only gaining +0.65% but in the process also reclaiming its $1,800 level by a small margin.

One analyst saw the current conditions this way:

“Rising tide of earnings is lifting all the boats and adding fuel to the bull market fire,” said Anu Gaggar, global investment strategist at Commonwealth Financial Network. “The 3Q earnings season is off to a strong start despite concerns about supply bottlenecks and labor shortages.”

Let’s see if it continues, because as of right now, October has been a good month for the major indexes.

Read More

ETFs On The Cutline – Updated Through 10/22/2021

Ulli ETFs on the Cutline Contact

Below, please find the latest High-Volume ETF Cutline report, which shows how far above or below their respective long-term trend lines (39-week SMA) my currently tracked ETFs are positioned.

This report covers the HV ETF Master List from Thursday’s StatSheet and includes 312 High Volume ETFs, defined as those with an average daily volume of more than $5 million, of which currently 223 (last week 224) are hovering in bullish territory. The yellow line separates those ETFs that are positioned above their trend line (%M/A) from those that have dropped below it.

Take a look:                                                                   

The HV ETF Master Cutline Report

In case you are not familiar with some of the terminology used in the reports, please read the Glossary of Terms. If you missed the original post about the Cutline approach, you can read it here.      

ETF Tracker Newsletter For October 22, 2021

Ulli ETF Tracker Contact

ETF Tracker StatSheet          

You can view the latest version here.

DOW CLOSES WEEK WITH NEW RECORD

[Chart courtesy of MarketWatch.com]

  1. Moving the markets

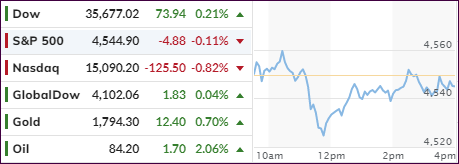
While the S&P 500 missed out on its 8th straight day of advances, the Dow powered ahead and eked out a new record high, thereby imitating yesterday’s S&P accomplishment. The latter surrendered -0.11%.

The Nasdaq was the laggard of the day, as two tech companies posted poor results. The more disappointing sales/revenue report came from powerhouse Intel, whose shares were hammered at the tune of -11% with investors not caring one bit that the miss was blamed on an industry-wide chip shortage.

Despite the S&P’s 1.7% gain this week, market jitters seem to pop up every so often, not only due to tech heavyweights like IBM and Intel disappointing, but also because of hawkish comments from Fed head Powell on inflation and policy tightening. Remember, if bond yields rise sharply, the fastest growing companies, as represented by the Nasdaq, will suffer first.

But, so far, the overall earnings season has been terrific with 84% of the 117 companies that have reported managing to beat earnings’ estimates. Consequently, the broader market has been boosted, which was reflected by this weeks’ record highs in the Dow and S&P 500.

The US Dollar limped lower today, and this week, while bond yields fell for the session, as the 10-year gave back almost 6 basis points and ended at 1.643%. This combination proved to be a boon for Gold, which at one point had gained +1.85%, while conquering the $1,800 level again, but gave back a good chunk. In the end, the precious metal still added +0.69%.

Looking at the big picture, it makes sense for equities to take a breather. After all, we just witnessed a 5% rally on seven green days for the S&P 500.

Read More

Weekly StatSheet For The ETF Tracker Newsletter – Updated Through 10/21/2021

Ulli ETF StatSheet Contact

ETF Data updated through Thursday, October 21, 2021

Methodology/Use of this StatSheet:

1. From the universe of over 1,800 ETFs, I have selected only those with a trading volume of over $5 million per day (HV ETFs), so that liquidity and a small bid/ask spread are assured.

2. Trend Tracking Indexes (TTIs)

Buy or Sell decisions for Domestic and International ETFs (section 1 and 2), are made based on the respective TTI and its position either above or below its long-term M/A (Moving Average). A crossing of the trend line from below accompanied by some staying power above constitutes a “Buy” signal. Conversely, a clear break below the line constitutes a “Sell” signal. Additionally, I use an 8% trailing stop loss on all positions in these categories to control downside risk.

3. All other investment arenas do not have a TTI and should be traded based on the position of the individual ETF relative to its own respective trend line (%M/A). That’s why those signals are referred to as a “Selective Buy.” In other words, if an ETF crosses its own trendline to the upside, a “Buy” signal is generated. Since these areas tend to be more volatile, I recommend a wider trailing sell stop of 8%-10% depending on your risk tolerance.

If you are unfamiliar with some of the terminology, please see Glossary of Terms and new subscriber information in section 9.     

1. DOMESTIC EQUITY ETFs: BUY — since 07/22/2020

Click on chart to enlarge

Our main directional indicator, the Domestic Trend Tracking Index (TTI-green line in the above chart) has now rallied above its long-term trend line (red) by +7.85% and remains in “BUY” mode as posted.

Read More

Keeping The Bullish Meme Intact

Ulli Market Commentary Contact

[Chart courtesy of MarketWatch.com]

  1. Moving the markets

With the bulls continuing their ascent to take out all-time highs, they succeeded by pushing the Dow into record territory, while S&P 500 “only” registered its sixth consecutive day of gains. The Nasdaq lagged by bouncing around its unchanged line while giving up early advances.

MarketWatch was correct with its analysis that the markets have climbed a wall of worries over the past two months. Fears over the delta Covid surge, supply chain hiccups, a China property crisis, the Fed signaling the removal of stimulus and surging inflation, rattled nerves on Wall Street but did not threaten the end of this bullish period.

Combining weaker-than-expected producer prices with better-than-expected bank earnings has so far been a winning combination, but it remains to be seen whether the former can be maintained, or if inflation indeed will rear its ugly head in the future, a view that I share.

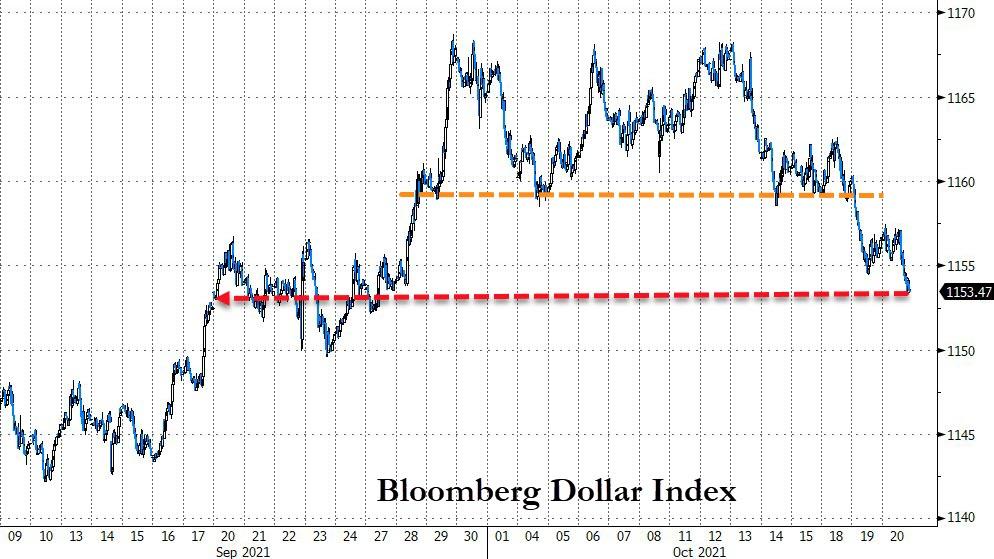
Dumping and jumping played out in different arenas. The US Dollar continued to dump, which Gold took advantage of by jumping 0.75% and again approaching its $1,800 level. Even gently rising bond yields could not take the starch out of gold’s rebound, with the ever-worsening inflationary background lending support to the precious metal.

I’ll be out tomorrow but will post the weekly StatSheet by 6:30 pm PST.

Read More