
- Moving the markets
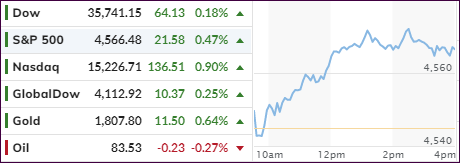
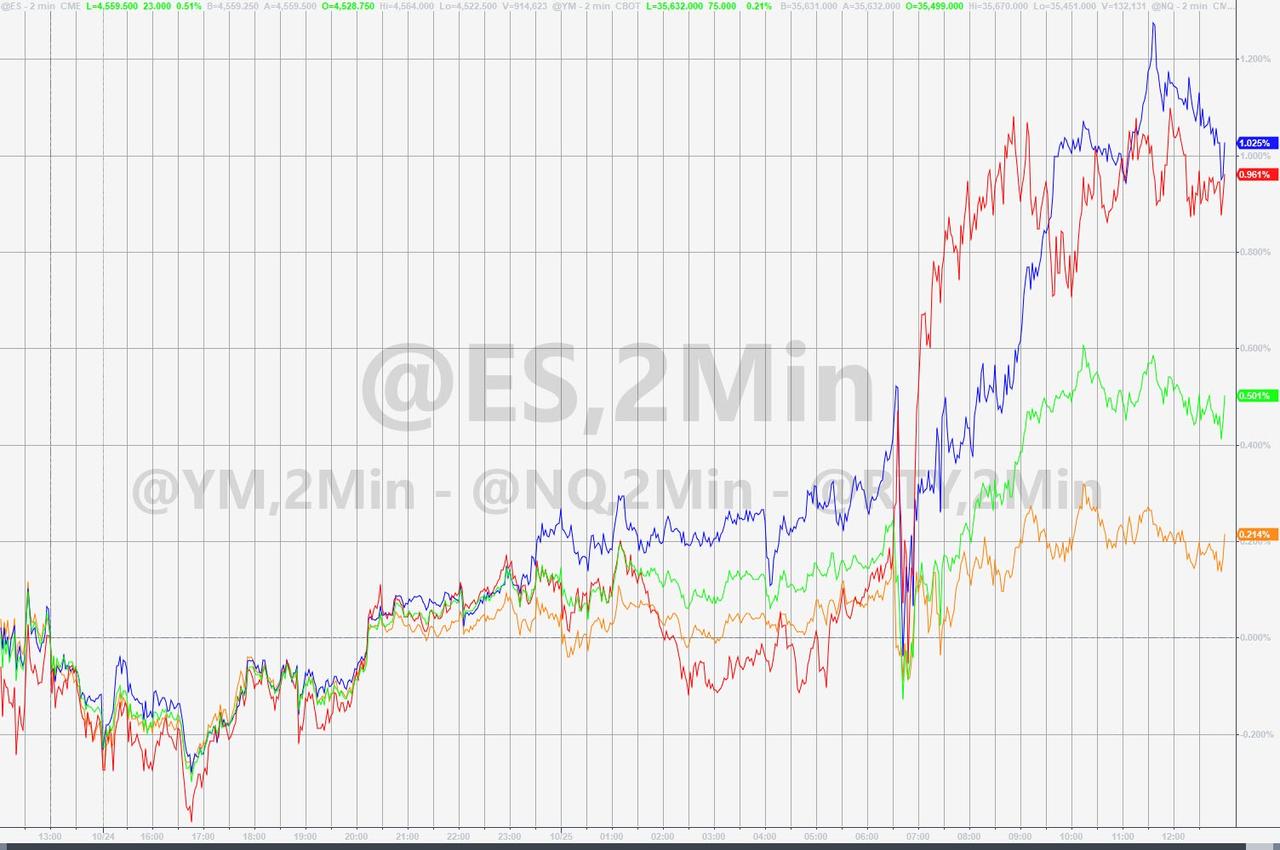
The bulls dominated again and managed to score another winning session and, in the process, pushed the Dow and S&P 500 to new intra-day highs. This move came ahead of a major week of earnings from the big tech heavyweights in anticipation of positive surprises. As a result, the Nasdaq lead the pack with a gain of +0.90%.
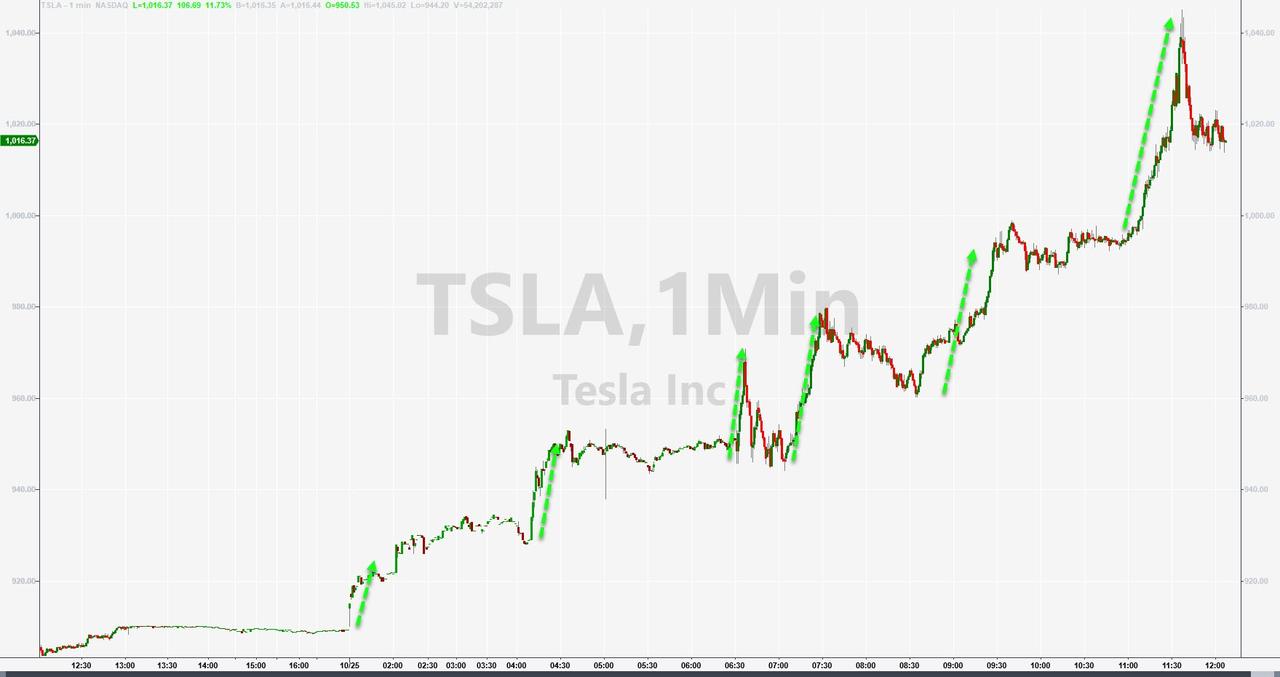
Tesla was on fire today with the stock gaining more than 9% and pushing the market cap to over $1 trillion, a move that was supported by Morgan Stanley hiking its price target from $900 to $1,200. Also lending an assist was rental car company Hertz’s announcement that it would order 100k Tesla vehicles.
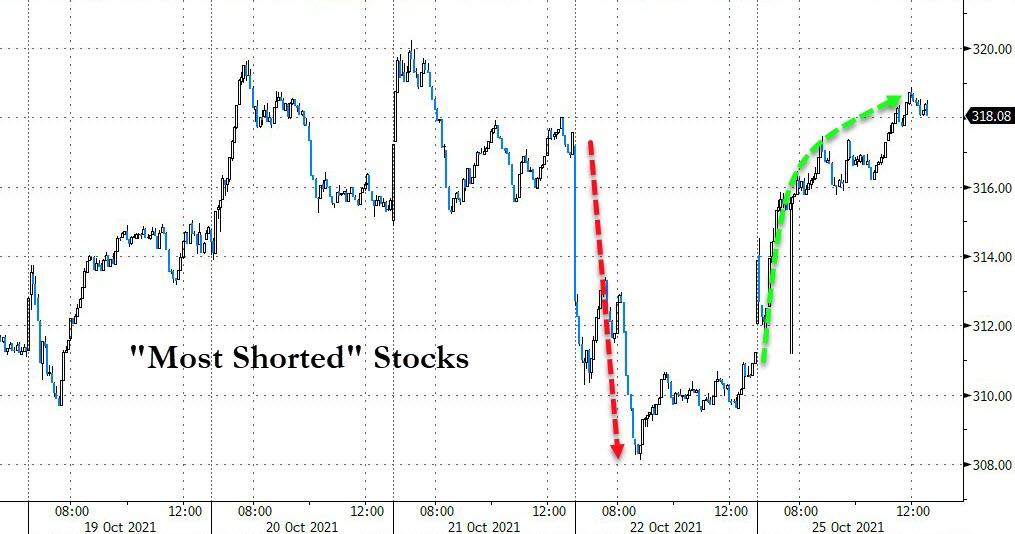
And as very often is the case, a well-timed short squeeze added support to the bullish theme thereby insuring a green close all the way around.
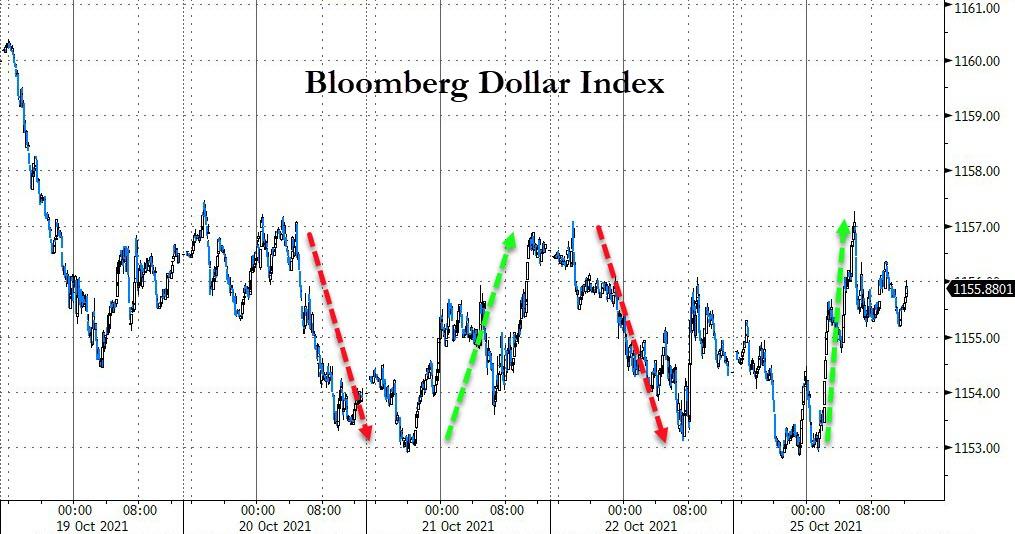
The US Dollar first dumped and then pumped to close modestly higher, thereby keeping its recent zig-zag pattern intact. Bond yields bounced below and above their respective unchanged lines and hugged them into the close.
As a result of only immaterial movements in the dollar and bond yields, gold continued its march higher by not only gaining +0.65% but in the process also reclaiming its $1,800 level by a small margin.
One analyst saw the current conditions this way:
“Rising tide of earnings is lifting all the boats and adding fuel to the bull market fire,” said Anu Gaggar, global investment strategist at Commonwealth Financial Network. “The 3Q earnings season is off to a strong start despite concerns about supply bottlenecks and labor shortages.”
Let’s see if it continues, because as of right now, October has been a good month for the major indexes.
2. ETFs in the Spotlight
In case you missed the announcement and description of this section, you can read it here again.
It features some of the 10 broadly diversified domestic and sector ETFs from my HighVolume list as posted every Saturday. Furthermore, they are screened for the lowest MaxDD% number meaning they have been showing better resistance to temporary sell offs than all others over the past year.
The below table simply demonstrates the magnitude with which these ETFs are fluctuating above or below their respective individual trend lines (%+/-M/A). A break below, represented by a negative number, shows weakness, while a break above, represented by a positive percentage, shows strength.
For hundreds of ETF choices, be sure to reference Thursday’s StatSheet.
For this current domestic “Buy” cycle, here’s how some our candidates have fared:
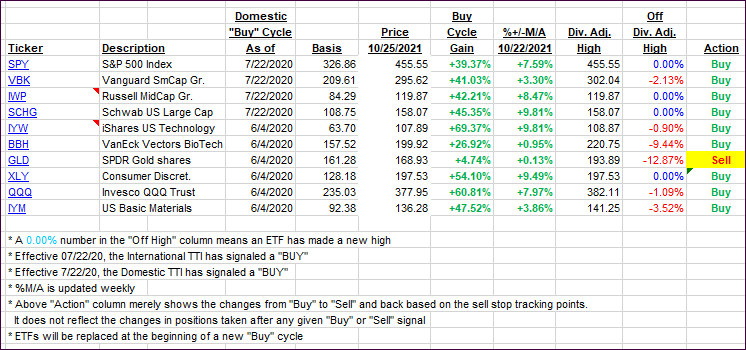
Click image to enlarge.
Again, the %+/-M/A column above shows the position of the various ETFs in relation to their respective long-term trend lines, while the trailing sell stops are being tracked in the “Off High” column. The “Action” column will signal a “Sell” once the -8% point has been taken out in the “Off High” column. For more volatile sector ETFs, the trigger point is -10%.
3. Trend Tracking Indexes (TTIs)
Our TTIs headed north supported by today’s broad advance.
This is how we closed 10/25/2021:
Domestic TTI: +7.86% above its M/A (prior close +7.62%)—Buy signal effective 07/22/2020.
International TTI: +4.38% above its M/A (prior close +4.11%)—Buy signal effective 07/22/2020.
Disclosure: I am obliged to inform you that I, as well as my advisory clients, own some of the ETFs listed in the above table. Furthermore, they do not represent a specific investment
recommendation for you, they merely show which ETFs from the universe I track are falling within the specified guidelines.
All linked charts above are courtesy of Bloomberg via ZeroHedge.
Contact Ulli