Fading Into The End Of The Month

Ulli Market Commentary Contact

[Chart courtesy of MarketWatch.com]

  1. Moving the markets

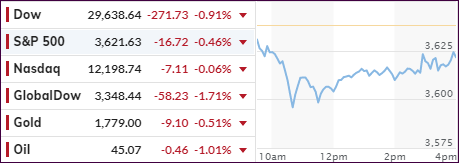
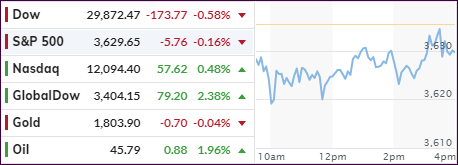
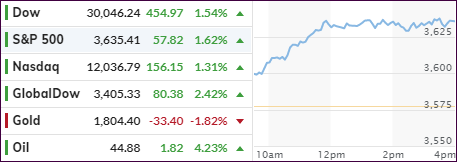
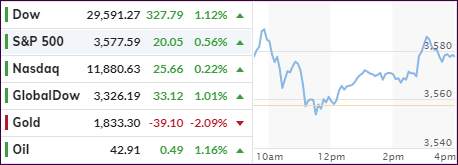
Despite the Dow having had its best month since 1987, the last day of November proved to be a downer with the major indexes slumping led by the Dow with the Nasdaq holding up the best.

This pretty much reflects this year’s performance when, despite the hype accompanying the Dow reaching the $30k level, the Nasdaq (QQQ) proved to be far superior by gaining +41.57% vs. the rather meager +3.86% of the Dow.

Opined JJ Kinahan, chief market strategist at TD Ameritrade:

“What’s really taken most people by surprise is that if anybody said to you in March, ‘Hey we’re going to have a year where really most businesses are working at not-full capacity, most restaurants may not even be open, people aren’t going to the office, and oh yeah, by the way, we’ll hit all-time highs,’ people would have thought you were nuts.”

“It’s been amazing.”

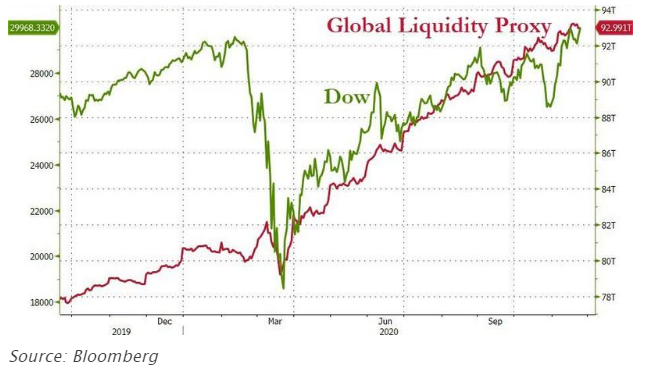
Yes, it has been JJ. But let’s not forget that the reason for this levitation has absolutely nothing to do with businesses working at full capacity or not, nor any other fundamentals, but it has everything to do with the $15 trillion rise in global liquidity, as I have posted ad nauseum:

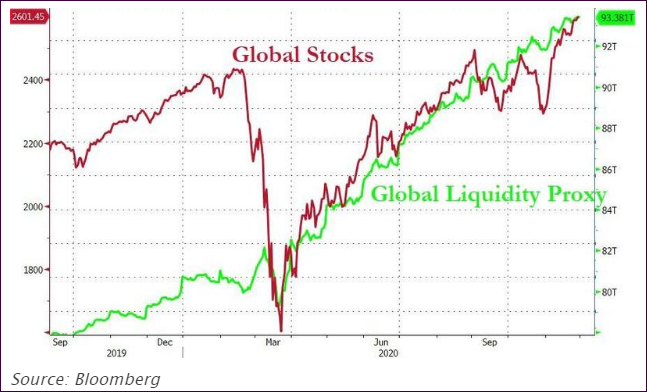
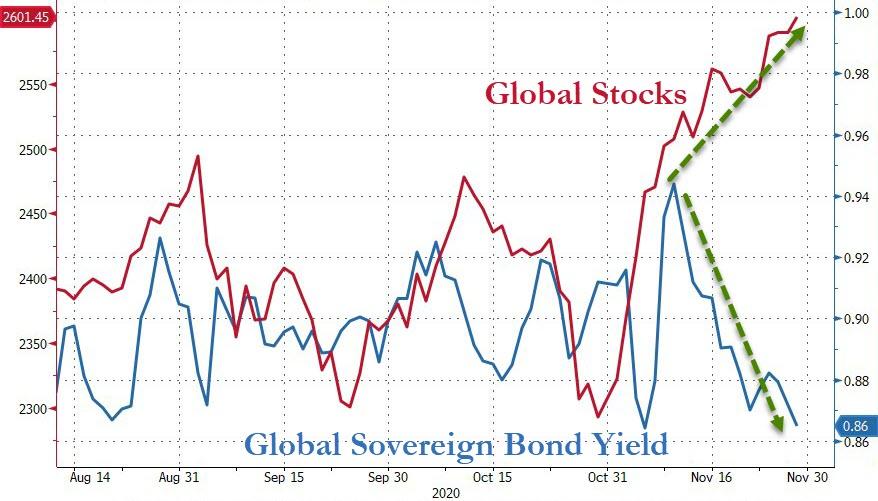
Because, if the reason for the rally had been one of improving fundamentals, we would not have seen the total disconnect between rising global stocks and tumbling bond yields, as Bloomberg shows in this chart. Increased liquidity and collapsing bond yields have made it possible to see stock markets rally in the face of sharply declining economies.

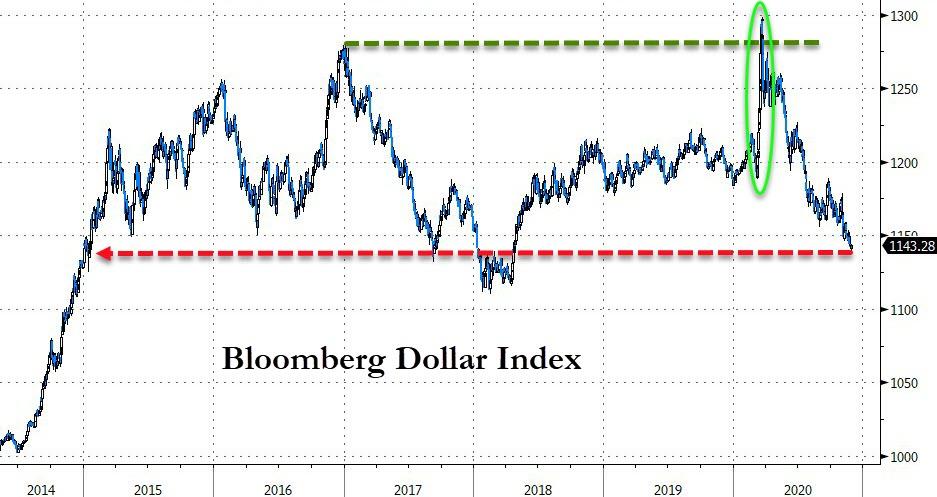
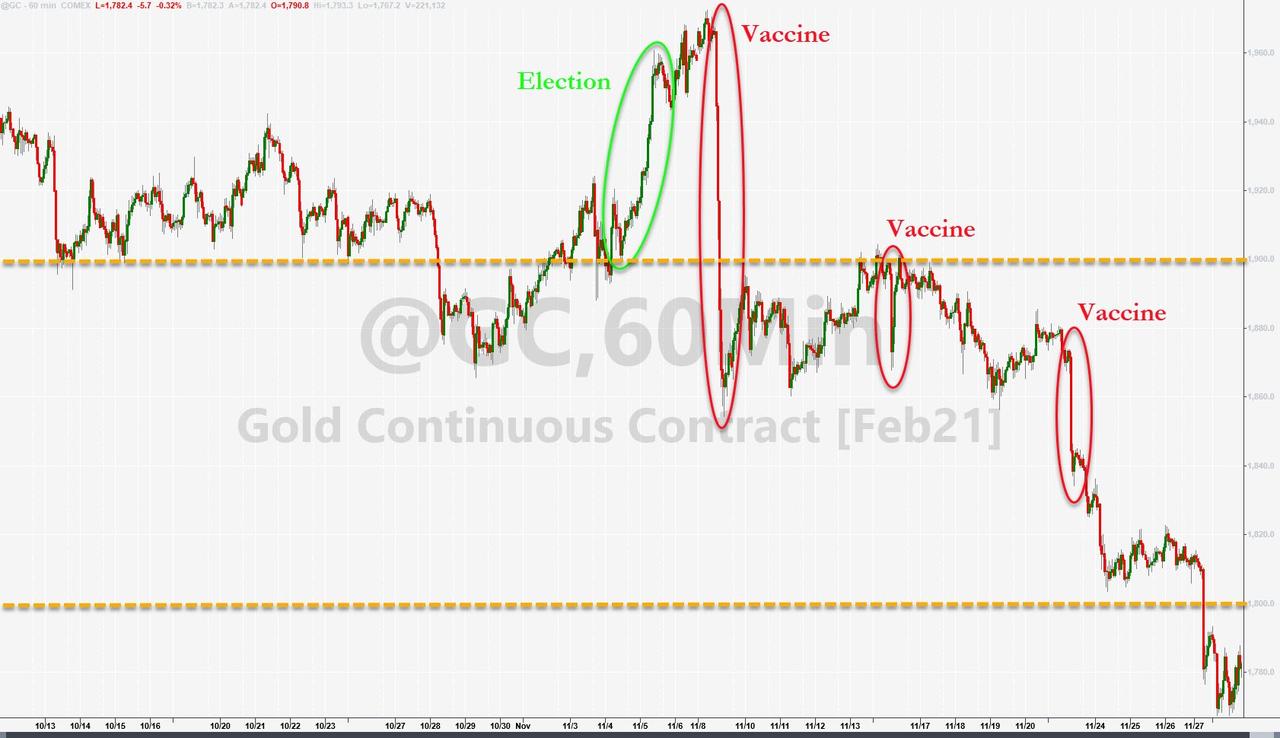
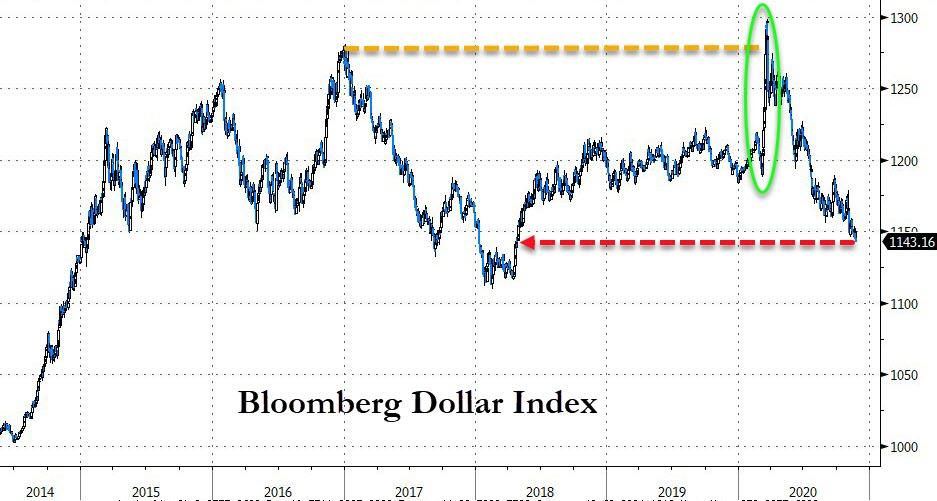
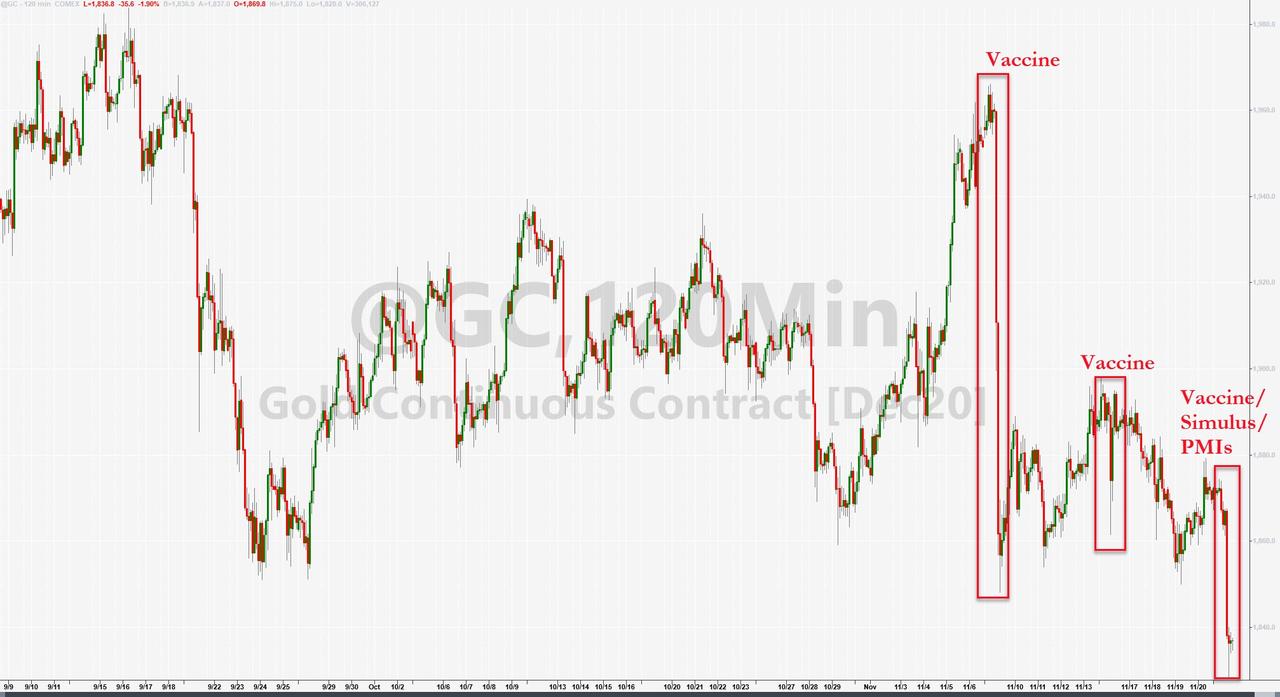
The oddity to me was that, despite the pummeling of the US Dollar, a corresponding rise in gold prices did not occur, which may be temporary but also could be troublesome. In my advisor practice, I have therefore reduced our gold holdings until such time that a new major uptrend can be established.

As far as the upcoming month of December is concerned, uncertainty will reign, and all options are on the table ranging from a melt-up in equities to a collapse. It’s important to have an exit strategy in place, should the latter occur.  

Read More

ETFs On The Cutline – Updated Through 11/27/2020

Ulli ETFs on the Cutline Contact

Below, please find the latest High-Volume ETF Cutline report, which shows how far above or below their respective long-term trend lines (39-week SMA) my currently tracked ETFs are positioned.

This report covers the HV ETF Master List from Thursday’s StatSheet and includes 312 High Volume ETFs, defined as those with an average daily volume of more than $5 million, of which currently 283 (last week 285) are hovering in bullish territory. The yellow line separates those ETFs that are positioned above their trend line (%M/A) from those that have dropped below it.

Take a look:                                                                   

The HV ETF Master Cutline Report

In case you are not familiar with some of the terminology used in the reports, please read the Glossary of Terms. If you missed the original post about the Cutline approach, you can read it here.      

Weekly StatSheet For The ETF Tracker Newsletter – Updated Through 11/25/2020

Ulli ETF StatSheet Contact

ETF Data updated through Wednesday, November 25, 2020

Methodology/Use of this StatSheet:

1. From the universe of over 1,800 ETFs, I have selected only those with a trading volume of over $5 million per day (HV ETFs), so that liquidity and a small bid/ask spread are assured.

2. Trend Tracking Indexes (TTIs)

Buy or Sell decisions for Domestic and International ETFs (section 1 and 2), are made based on the respective TTI and its position either above or below its long-term M/A (Moving Average). A crossing of the trend line from below accompanied by some staying power above constitutes a “Buy” signal. Conversely, a clear break below the line constitutes a “Sell” signal. Additionally, I use a 7.5% trailing stop loss on all positions in these categories to control downside risk.

3. All other investment arenas do not have a TTI and should be traded based on  the position of the individual ETF relative to its own respective trend line (%M/A). That’s why those signals are referred to as a “Selective Buy.” In other words, if an ETF crosses its own trendline to the upside, a “Buy” signal is generated. Since these areas tend to be more volatile, I recommend a wider trailing sell stop of 7.5% -10% depending on your risk tolerance.

If you are unfamiliar with some of the terminology, please see Glossary of Terms and new subscriber information in section 9.     

1. DOMESTIC EQUITY ETFs: BUY — since 07/22/2020

Click on chart to enlarge

Our main directional indicator, the Domestic Trend Tracking Index (TTI-green line in the above chart) has now rallied above its long-term trend line (red) by +21.38% and remains in “BUY” mode as posted.

Read More

Pulling Back From All-Time Highs

Ulli Market Commentary Contact

[Chart courtesy of MarketWatch.com]

  1. Moving the markets

As could be expected, trading volumes slowed to a crawl ahead of the Thanksgiving holiday. The Nasdaq finally managed to score a winning session, handily beating the S&P 500, after having lagged over the past few weeks.

On the economic side, things don’t show much improvement with the Labor Department reporting that Initial Jobless Claims rose for the second week at a rate of 778k vs. expected 730k, which was worse than the prior week’s reading of 742k.

Add to this yesterday’s disappointing drop in consumer confidence and today’s mixed sentiment survey, none of which are awe inspiring, which leads me again to the primary reason for having seen the stock market bubble inflate at such a rapid pace, which is represented in this chart:

If it had not been for the creation of some $14 trillion of liquidity over the past few months, the Dow $30k level might only be a wishful number, while the other indexes would be sharply lower.

However, such is the environment we are living in and have to deal with, but I can assure you that this reckless approach to propping up markets, while devaluing the US dollar, will not end well—but it can go one for a while longer.

I will be out on Friday, so there will be no report, but I will post the StatSheet later today and the “ETFs on the Cutline” on Saturday.

Have a great Thanksgiving.

Read More

Hope For 2021 Recovery Stokes Markets

Ulli Market Commentary Contact

[Chart courtesy of MarketWatch.com]

  1. Moving the markets

More positive vaccine news coupled with newfound hope for a strong economic recovery next year and some easing of political uncertainty, although the election has not been decided yet, combined forces to propel the markets higher. A well-timed short-squeeze lent an assist again.

This weighed heavily:

Traders also cheered on Tuesday the increasing political clarity after General Services Administration chief Emily Murphy told President-elect Joe Biden that the Trump administration is making federal resources available for his transition into office.

Low volume, due to most traders being out for this Holiday week, made it easy for the bulls to shove the indexes higher, despite tumbling Consumer Confidence, rocketing Covid cases and humiliating business lockdowns. We will find out next week whether this levitation, which has now been called a blow-off top, really has legs when Wall Street is fully staffed again.

We have seen a post-election plunge in fear and surge in greed,” as Nomura’s McElligott called it. The Volatility Index (VIX) has collapsed with incredible speed, as a result of “US conditions having hit all-time easiest levels.”  That has promoted reckless buying with both hands and feet, however, the strange anomaly is that insiders have been selling. Who will be right in the end? No one knows, but when this bubble unwinds, it will be painful.

Be that as it may, during these post election “risk-on” times, gold has been slammed as has been the tech sector, however, the latter has been holding up better than the former. I will take the upcoming long weekend as an opportunity to re-evaluate our current holdings and adjust next week when everyone is back at their computers ready to push the buy and sell buttons.

Read More

Vaccine News + Short Squeeze = Higher Stocks

Ulli Market Commentary Contact

[Chart courtesy of MarketWatch.com]

  1. Moving the markets

The futures markets pointed to higher equity prices, as AstraZeneca became the latest competitor in the Covid-19 vaccine creation fest saying its product would be 90% effective.

News over the weekend that the first vaccine could be available within weeks after the anticipated FDA approval in mid-December helped the market continue its northerly path during the regular session.

A mid-day sell-off was the result of suggestions from the Biden administration that there would be no compromise on stimulus, which caused the US Dollar to spike and gold getting hammered. I expect this condition to be ephemeral in nature and look for a reversal by sometime next week.

The main beneficiary of today’s vaccine news was Small Caps, which soared to a record high, as the result of a gigantic short-squeeze and a bulletin that Biden’s primary pick for Treasury Secretary would be stimulus-hungry Janet Yellen.   

In the end, the Dow lead the major indexes, with the Nasdaq lagging, as Apple got clobbered and lost some 3%, in the process breaking below its 50-day M/A.

ZH noted that hard (real economy) and soft (survey) data have massively decoupled on nothing but a sea of hope:

Sooner or later, I expect a recoupling to occur.

Could it be the forced selling of up to $310 billion by year-end due to the upcoming pension rebalancing of their 60/40 equity/bonds split, as JP Morgan claims?

We will have to wait to find out…

Read More