
- Moving the markets
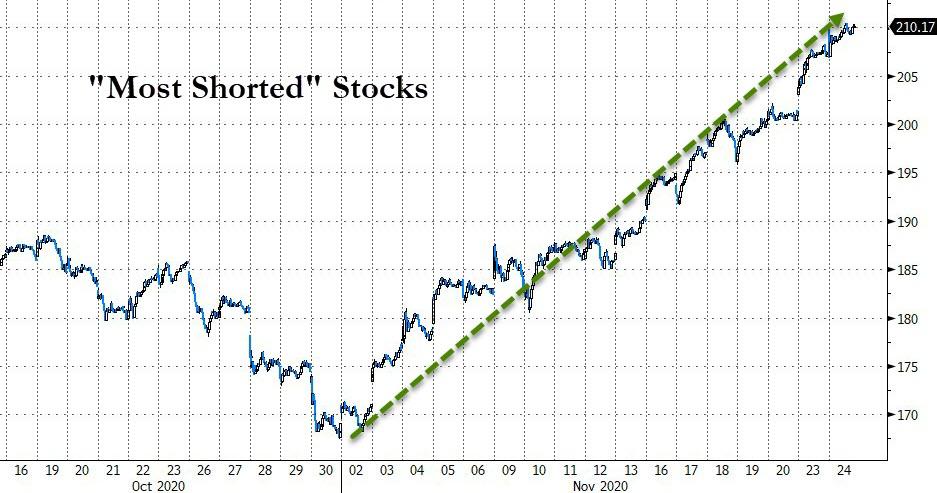
More positive vaccine news coupled with newfound hope for a strong economic recovery next year and some easing of political uncertainty, although the election has not been decided yet, combined forces to propel the markets higher. A well-timed short-squeeze lent an assist again.
This weighed heavily:
Traders also cheered on Tuesday the increasing political clarity after General Services Administration chief Emily Murphy told President-elect Joe Biden that the Trump administration is making federal resources available for his transition into office.
Low volume, due to most traders being out for this Holiday week, made it easy for the bulls to shove the indexes higher, despite tumbling Consumer Confidence, rocketing Covid cases and humiliating business lockdowns. We will find out next week whether this levitation, which has now been called a blow-off top, really has legs when Wall Street is fully staffed again.
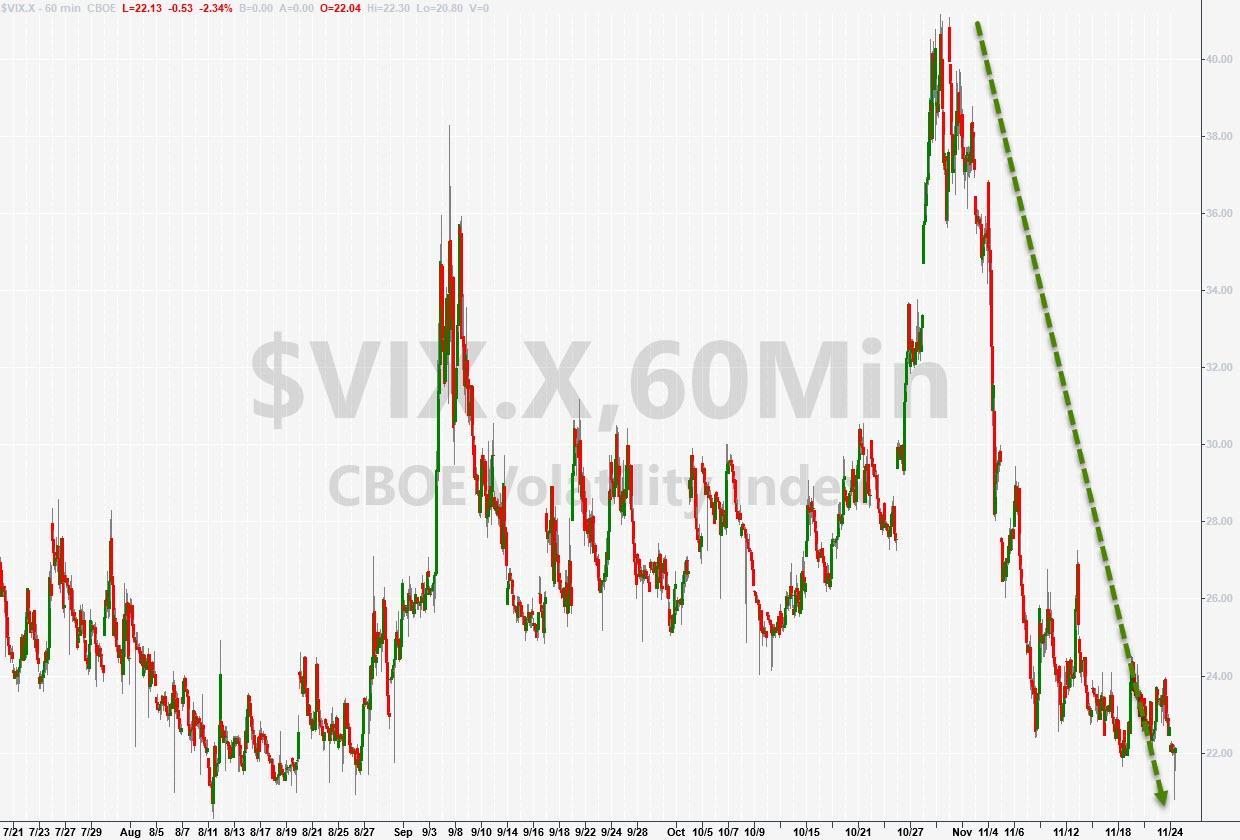
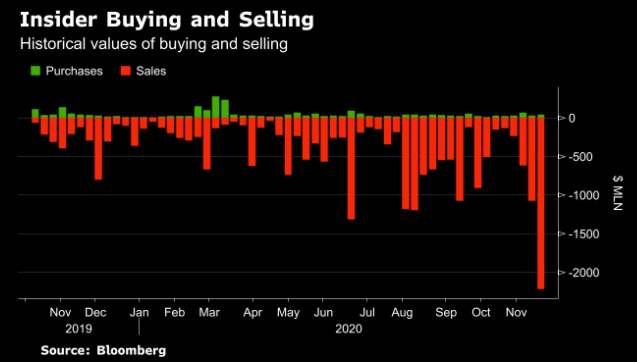
“We have seen a post-election plunge in fear and surge in greed,” as Nomura’s McElligott called it. The Volatility Index (VIX) has collapsed with incredible speed, as a result of “US conditions having hit all-time easiest levels.” That has promoted reckless buying with both hands and feet, however, the strange anomaly is that insiders have been selling. Who will be right in the end? No one knows, but when this bubble unwinds, it will be painful.
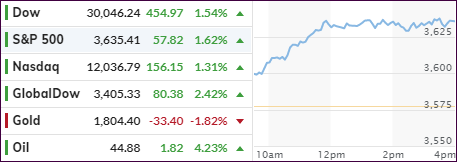
Be that as it may, during these post election “risk-on” times, gold has been slammed as has been the tech sector, however, the latter has been holding up better than the former. I will take the upcoming long weekend as an opportunity to re-evaluate our current holdings and adjust next week when everyone is back at their computers ready to push the buy and sell buttons.
2. ETFs in the Spotlight
In case you missed the announcement and description of this section, you can again.
It features some of the 10 broadly diversified domestic and sector ETFs from my HighVolume list as posted every Saturday. Furthermore, they are screened for the lowest MaxDD% number meaning they have been showing better resistance to temporary sell offs than all others over the past year.
The below table simply demonstrates the magnitude with which these ETFs are fluctuating above or below their respective individual trend lines (%+/-M/A). A break below, represented by a negative number, shows weakness, while a break above, represented by a positive percentage, shows strength.
For hundreds of ETF choices, be sure to reference Thursday’s StatSheet.
For this current domestic “Buy” cycle, here’s how some our candidates have fared:
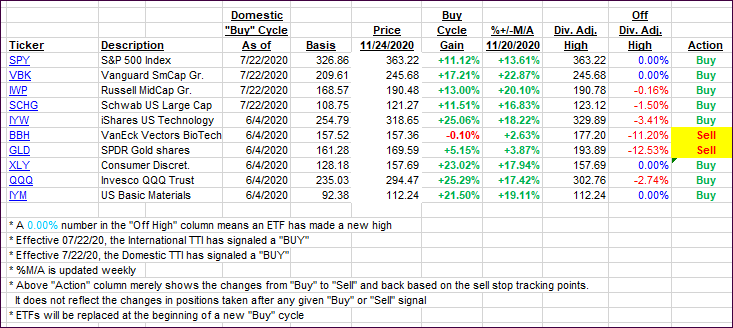
Click image to enlarge
Again, the %+/-M/A column above shows the position of the various ETFs in relation to their respective long-term trend lines, while the trailing sell stops are being tracked in the “Off High” column. The “Action” column will signal a “Sell” once the -8% point has been taken out in the “Off High” column. For more volatile sector ETFs, the trigger point is -10%.
3. Trend Tracking Indexes (TTIs)
Our TTIs jumped again as none of these lofty levels make any sense. To me, they represent nothing but a giant bubble waiting to be pricked.
This is how we closed 11/24/2020:
Domestic TTI: +22.29% above its M/A (prior close +19.68%)—Buy signal effective 07/22/2020
International TTI: +19.61% above its M/A (prior close +16.83%)—Buy signal effective 07/22/2020
Disclosure: I am obliged to inform you that I, as well as my advisory clients, own some of the ETFs listed in the above table. Furthermore, they do not represent a specific investment recommendation for you, they merely show which ETFs from the universe I track are falling within the specified guidelines.
Contact Ulli