
- Moving the markets
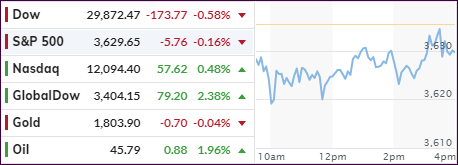
As could be expected, trading volumes slowed to a crawl ahead of the Thanksgiving holiday. The Nasdaq finally managed to score a winning session, handily beating the S&P 500, after having lagged over the past few weeks.
On the economic side, things don’t show much improvement with the Labor Department reporting that Initial Jobless Claims rose for the second week at a rate of 778k vs. expected 730k, which was worse than the prior week’s reading of 742k.
Add to this yesterday’s disappointing drop in consumer confidence and today’s mixed sentiment survey, none of which are awe inspiring, which leads me again to the primary reason for having seen the stock market bubble inflate at such a rapid pace, which is represented in this chart:
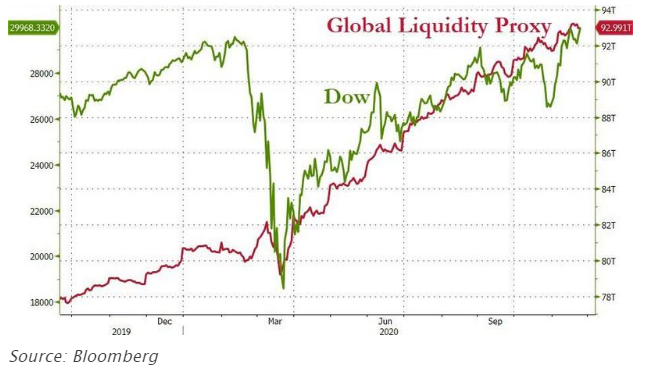
If it had not been for the creation of some $14 trillion of liquidity over the past few months, the Dow $30k level might only be a wishful number, while the other indexes would be sharply lower.
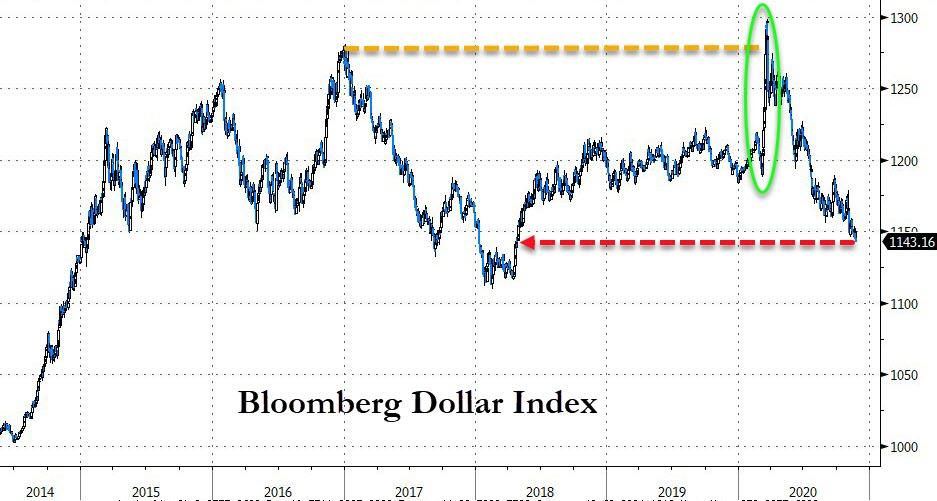
However, such is the environment we are living in and have to deal with, but I can assure you that this reckless approach to propping up markets, while devaluing the US dollar, will not end well—but it can go one for a while longer.
I will be out on Friday, so there will be no report, but I will post the StatSheet later today and the “ETFs on the Cutline” on Saturday.
Have a great Thanksgiving.
2. ETFs in the Spotlight
In case you missed the announcement and description of this section, you can again.
It features some of the 10 broadly diversified domestic and sector ETFs from my HighVolume list as posted every Saturday. Furthermore, they are screened for the lowest MaxDD% number meaning they have been showing better resistance to temporary sell offs than all others over the past year.
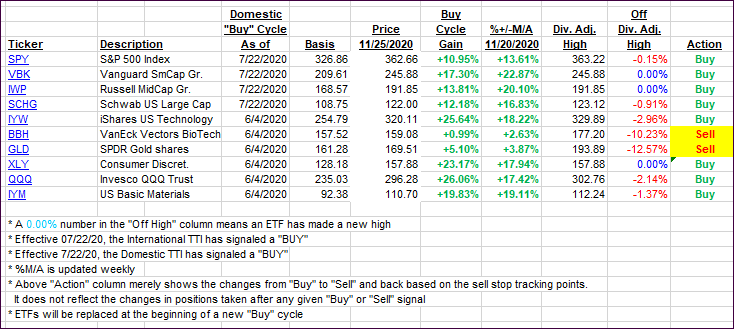
The below table simply demonstrates the magnitude with which these ETFs are fluctuating above or below their respective individual trend lines (%+/-M/A). A break below, represented by a negative number, shows weakness, while a break above, represented by a positive percentage, shows strength.
For hundreds of ETF choices, be sure to reference Thursday’s StatSheet.
For this current domestic “Buy” cycle, here’s how some our candidates have fared:
Click image to enlarge
Again, the %+/-M/A column above shows the position of the various ETFs in relation to their respective long-term trend lines, while the trailing sell stops are being tracked in the “Off High” column. The “Action” column will signal a “Sell” once the -8% point has been taken out in the “Off High” column. For more volatile sector ETFs, the trigger point is -10%.
3. Trend Tracking Indexes (TTIs)
Our TTIs slipped as upward momentum slowed prior to Thanksgiving.
This is how we closed 11/25/2020:
Domestic TTI: +21.38% above its M/A (prior close +22.29%)—Buy signal effective 07/22/2020
International TTI: +19.56% above its M/A (prior close +19.61%)—Buy signal effective 07/22/2020
Disclosure: I am obliged to inform you that I, as well as my advisory clients, own some of the ETFs listed in the above table. Furthermore, they do not represent a specific investment recommendation for you, they merely show which ETFs from the universe I track are falling within the specified guidelines.
Contact Ulli