
- Moving the markets
The futures markets pointed to higher equity prices, as AstraZeneca became the latest competitor in the Covid-19 vaccine creation fest saying its product would be 90% effective.
News over the weekend that the first vaccine could be available within weeks after the anticipated FDA approval in mid-December helped the market continue its northerly path during the regular session.
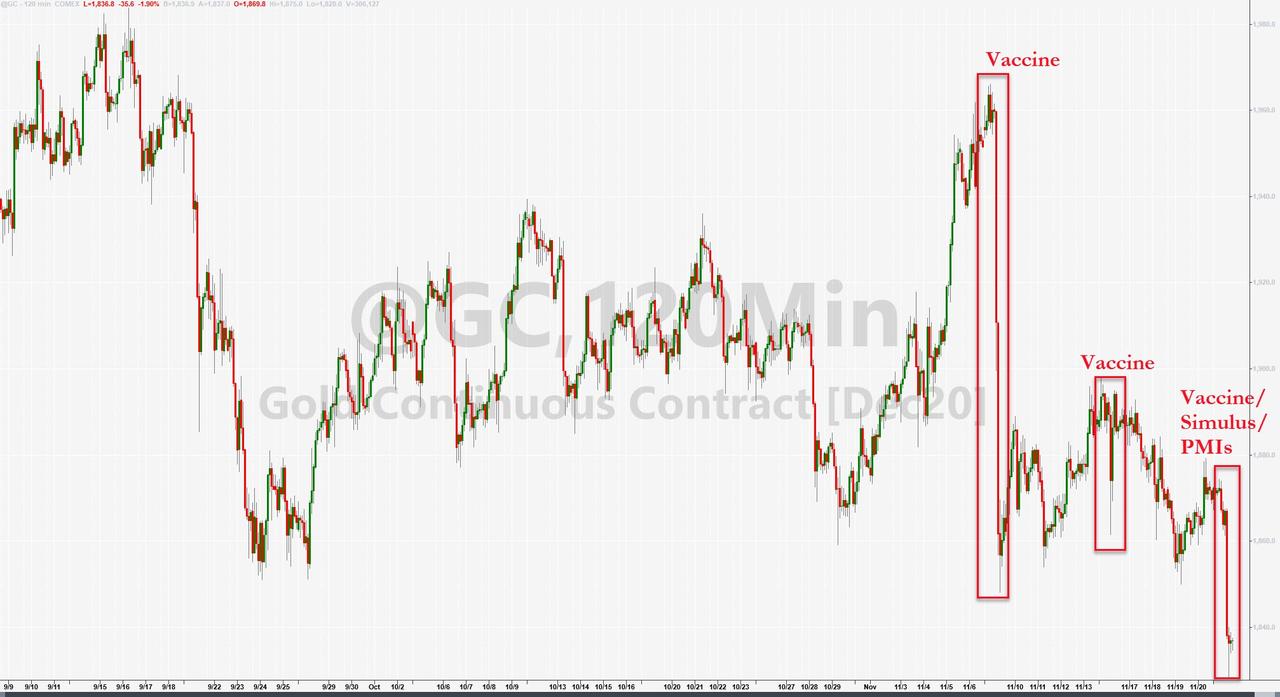
A mid-day sell-off was the result of suggestions from the Biden administration that there would be no compromise on stimulus, which caused the US Dollar to spike and gold getting hammered. I expect this condition to be ephemeral in nature and look for a reversal by sometime next week.
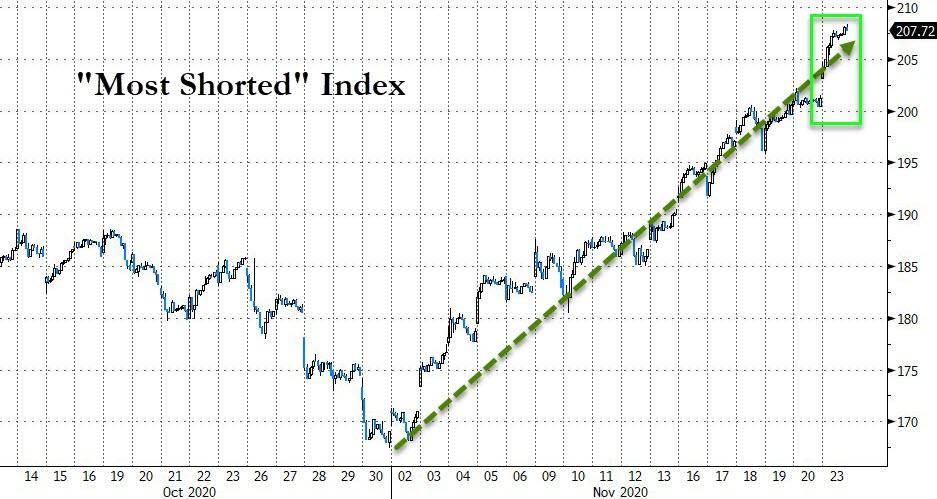
The main beneficiary of today’s vaccine news was Small Caps, which soared to a record high, as the result of a gigantic short-squeeze and a bulletin that Biden’s primary pick for Treasury Secretary would be stimulus-hungry Janet Yellen.
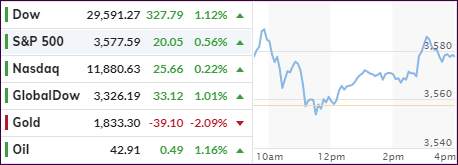
In the end, the Dow lead the major indexes, with the Nasdaq lagging, as Apple got clobbered and lost some 3%, in the process breaking below its 50-day M/A.
ZH noted that hard (real economy) and soft (survey) data have massively decoupled on nothing but a sea of hope:
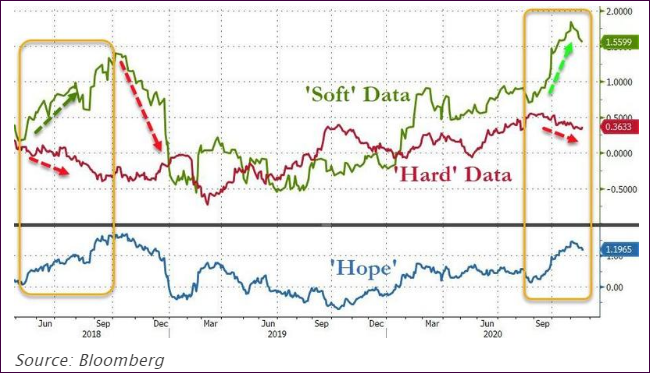
Sooner or later, I expect a recoupling to occur.
Could it be the forced selling of up to $310 billion by year-end due to the upcoming pension rebalancing of their 60/40 equity/bonds split, as JP Morgan claims?
We will have to wait to find out…
2. ETFs in the Spotlight
In case you missed the announcement and description of this section, you can read it here again.
It features some of the 10 broadly diversified domestic and sector ETFs from my HighVolume list as posted every Saturday. Furthermore, they are screened for the lowest MaxDD% number meaning they have been showing better resistance to temporary sell offs than all others over the past year.
The below table simply demonstrates the magnitude with which these ETFs are fluctuating above or below their respective individual trend lines (%+/-M/A). A break below, represented by a negative number, shows weakness, while a break above, represented by a positive percentage, shows strength.
For hundreds of ETF choices, be sure to reference Thursday’s StatSheet.
For this current domestic “Buy” cycle, here’s how some our candidates have fared:
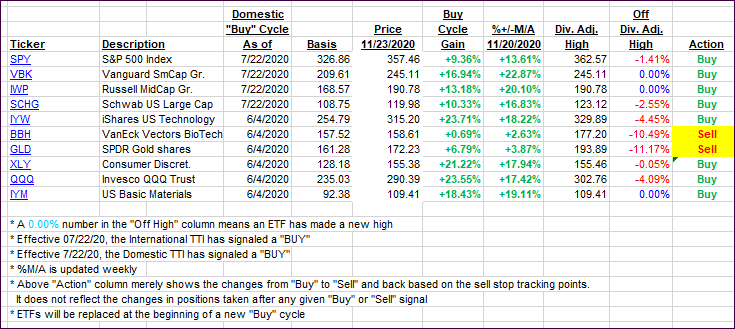
Click image to enlarge
Again, the %+/-M/A column above shows the position of the various ETFs in relation to their respective long-term trend lines, while the trailing sell stops are being tracked in the “Off High” column. The “Action” column will signal a “Sell” once the -8% point has been taken out in the “Off High” column. For more volatile sector ETFs, the trigger point is -10%.
3. Trend Tracking Indexes (TTIs)
Our TTIs raced higher despite only modest gains in the S&P and Nasdaq.
This is how we closed 11/23/2020:
Domestic TTI: +19.68% above its M/A (prior close +17.93%)—Buy signal effective 07/22/2020
International TTI: +16.83% above its M/A (prior close +15.67%)—Buy signal effective 07/22/2020
Disclosure: I am obliged to inform you that I, as well as my advisory clients, own some of the ETFs listed in the above table. Furthermore, they do not represent a specific investment recommendation for you, they merely show which ETFs from the universe I track are falling within the specified guidelines.
Contact Ulli