Cooling Off

Ulli Market Commentary Contact

[Chart courtesy of MarketWatch.com]

  1. Moving the markets

The futures markets were mixed due to fresh tensions between China and the U.S., with uncertainty rising as progress on the coronavirus relief bill was nowhere in sight.

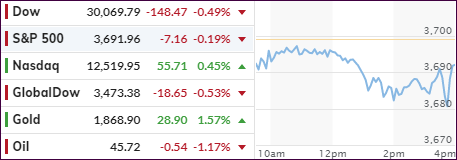
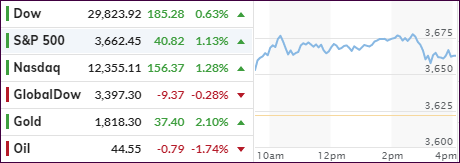
This theme carried into the regular session where two of the major indexes headed south and never crawled back out of the red zone. The Nasdaq diverged and solidly meandered above its unchanged line the entire time.

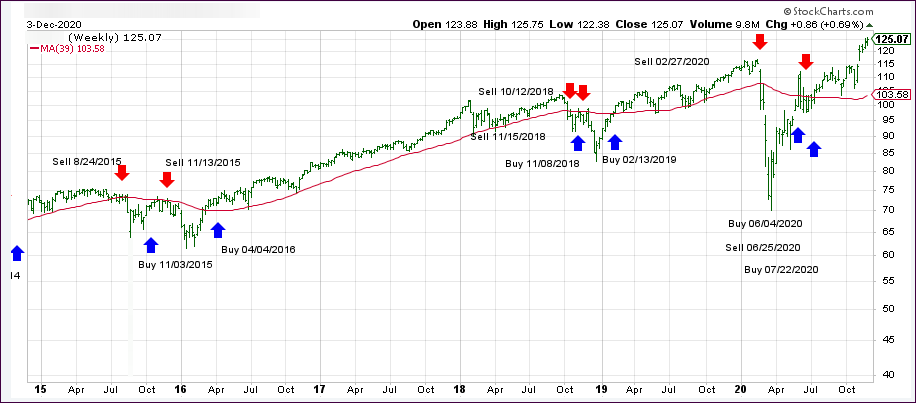
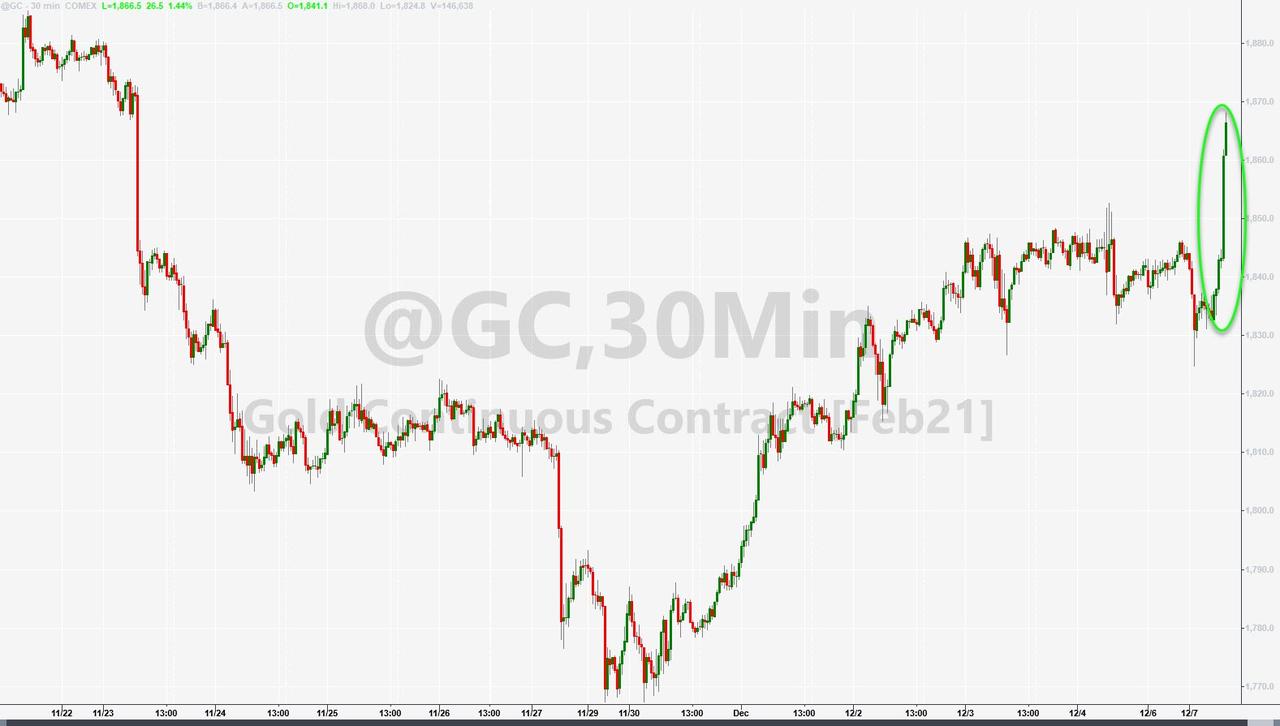
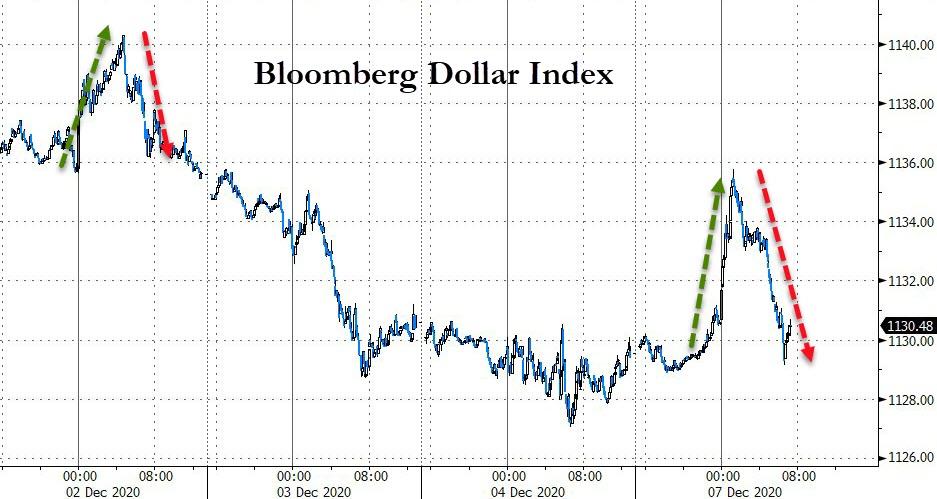
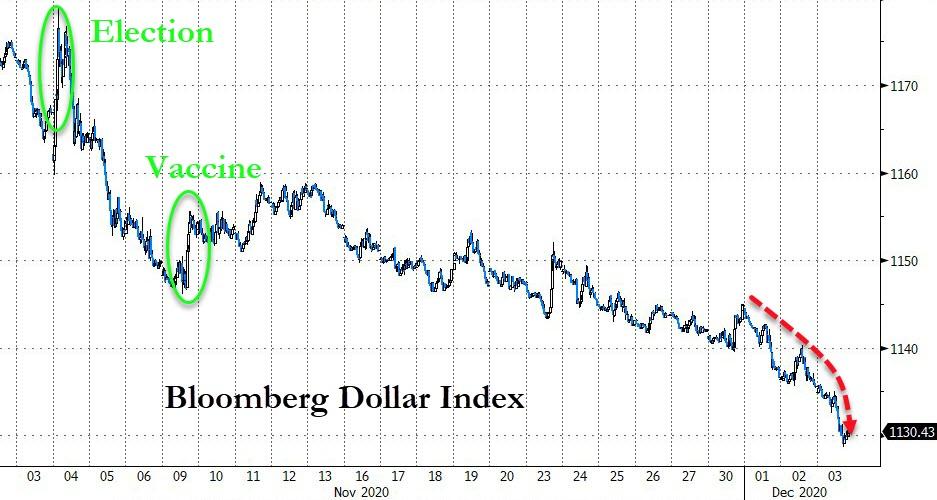
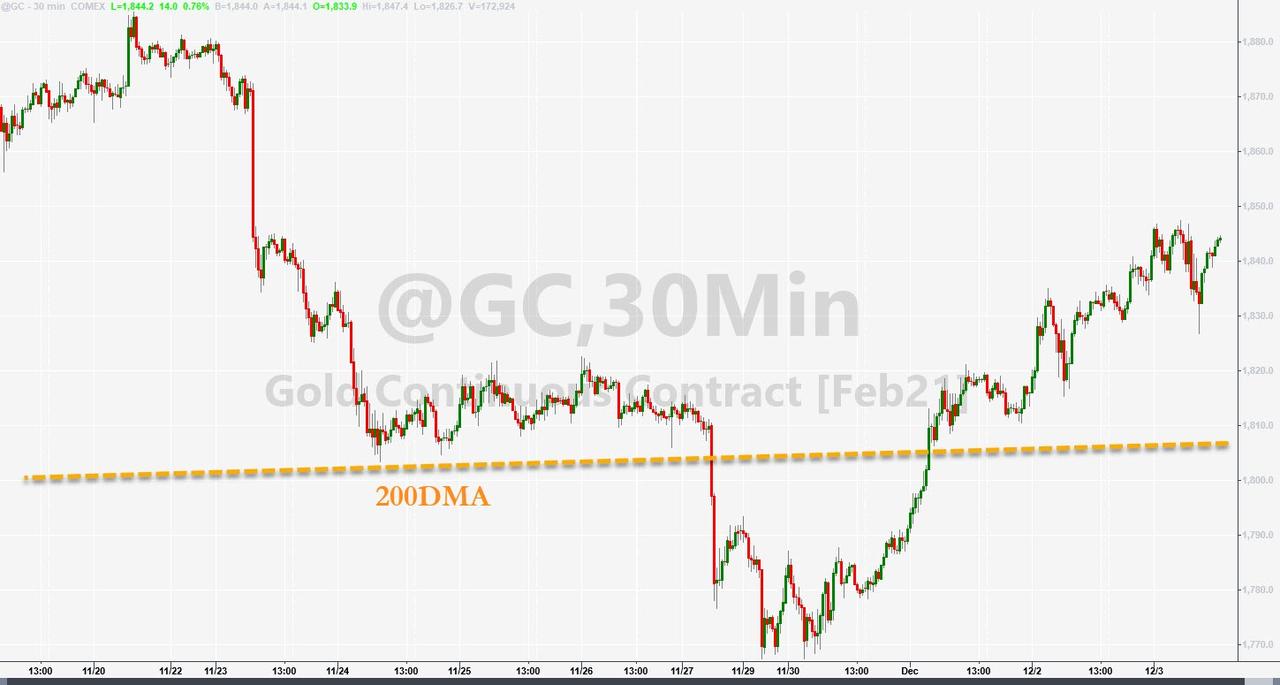
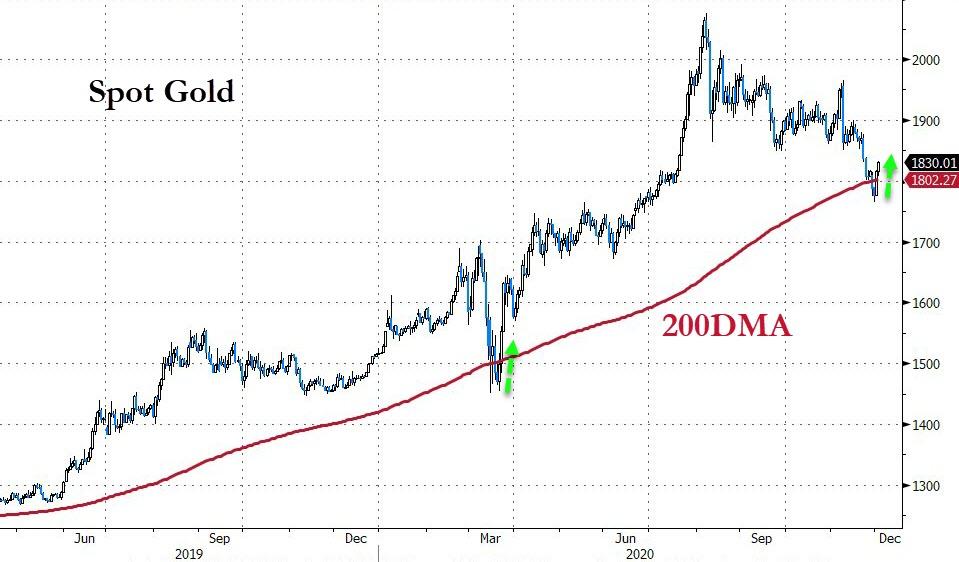
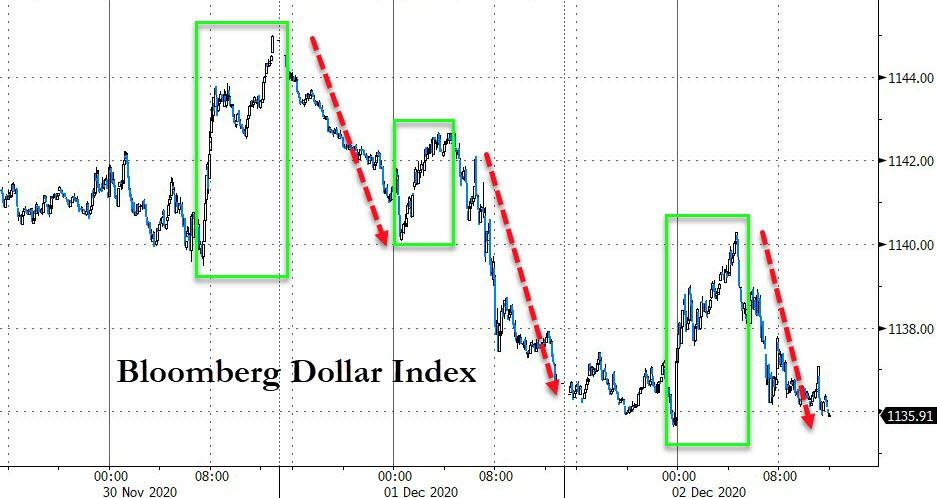
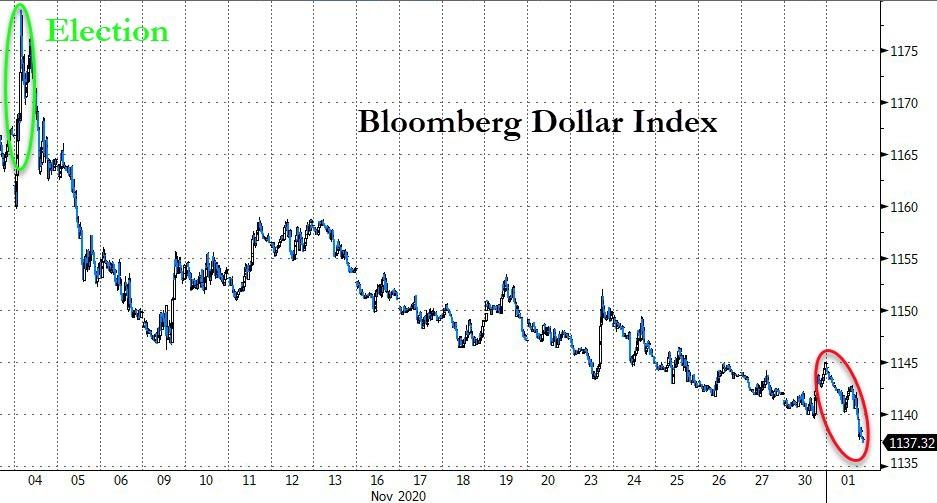
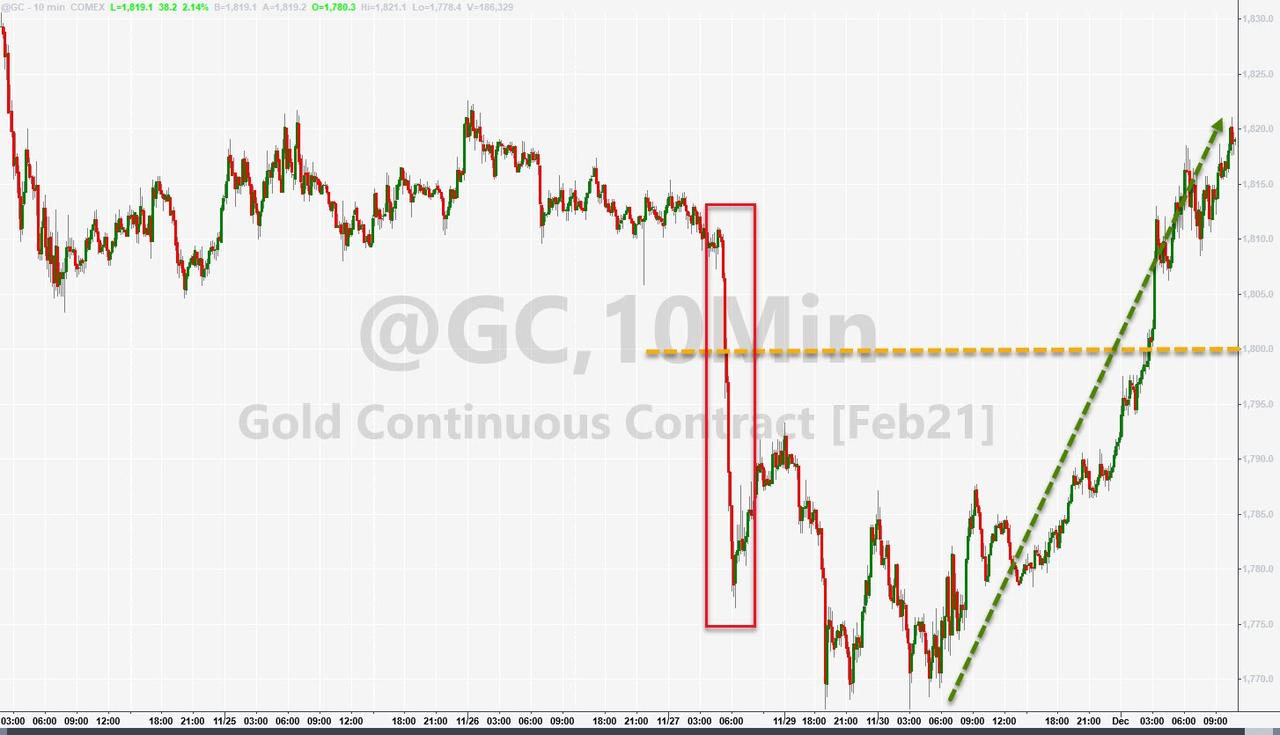
SmallCap Growth ETFs rallied as Value ETFs slipped. However, the dominant gainer was gold (GLD), which rebounded +1.47% and reclaimed its 200-day M/A. The US dollar index assisted by giving back much of an early bounce.

With Covid-19 related cases rising, calls for more stimulus have been increasing, but lawmakers are continuing to struggle with a solution. Additionally, government funding needs to be extended to buy more time to avoid a shutdown.

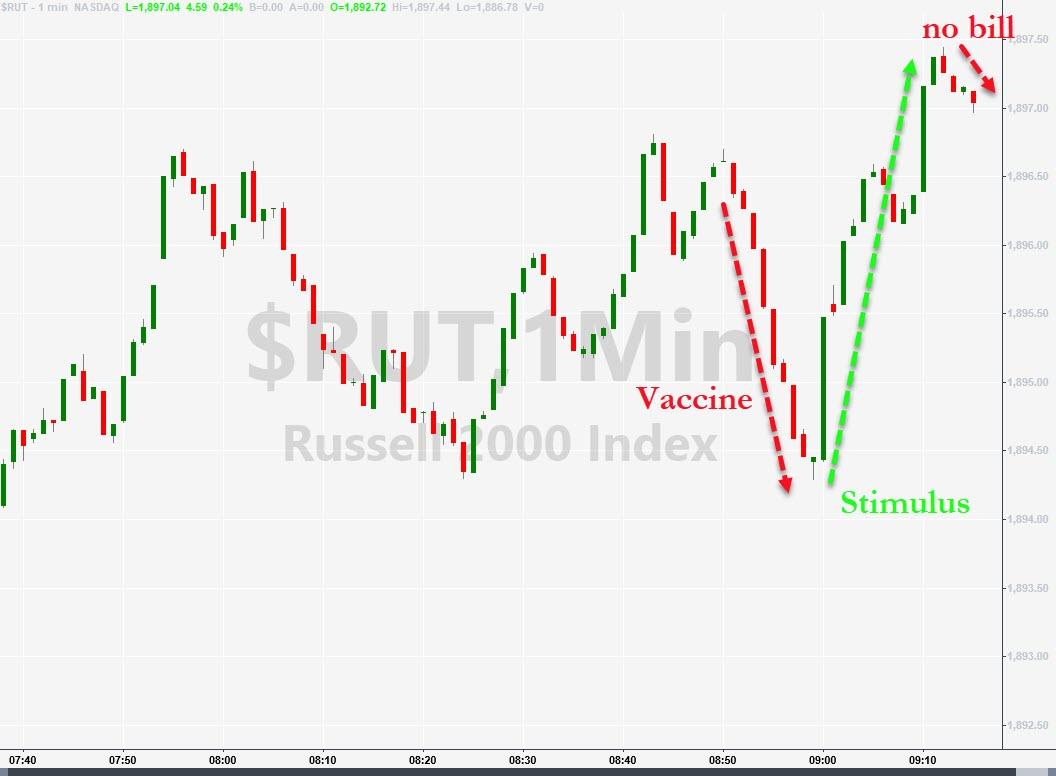
ZH posted these critical headlines:

  • 1154ET: SOME STATES’ COVID VACCINE ESTIMATES USED OUTDATED FIGURES, STATE FIGURES ASSUMED MORE PFIZER SHOTS WOULD BE AVAILABLE”
  • 1200ET: McConnell re-evaluating liability protection, to announce $900bn bill at 3pm
  • 1215ET: McConnell will not be announcing bill at 3pm

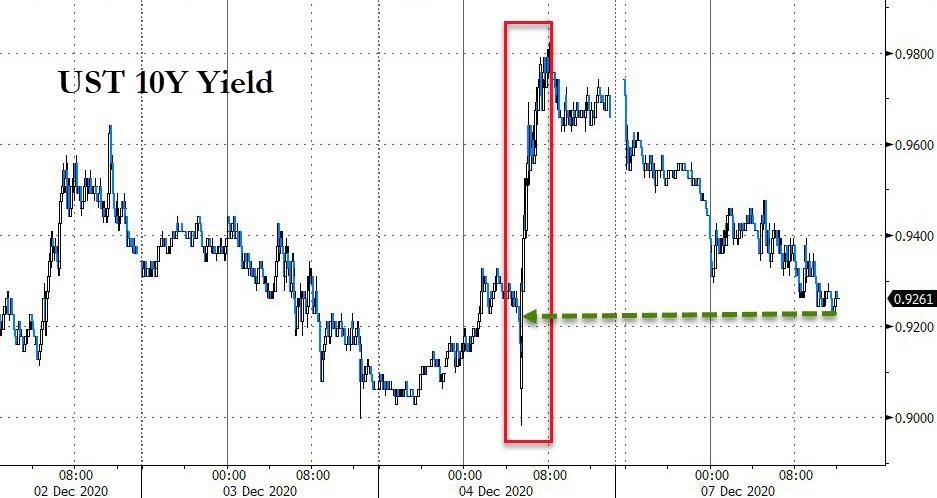
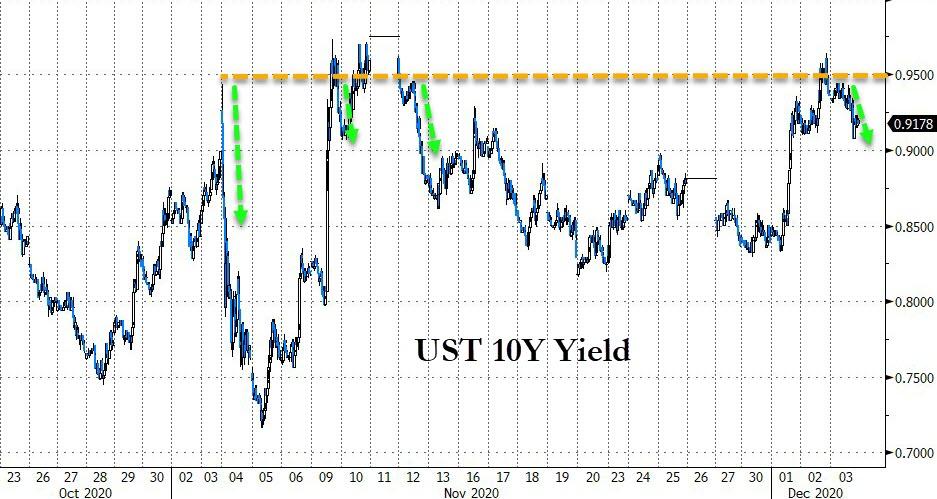
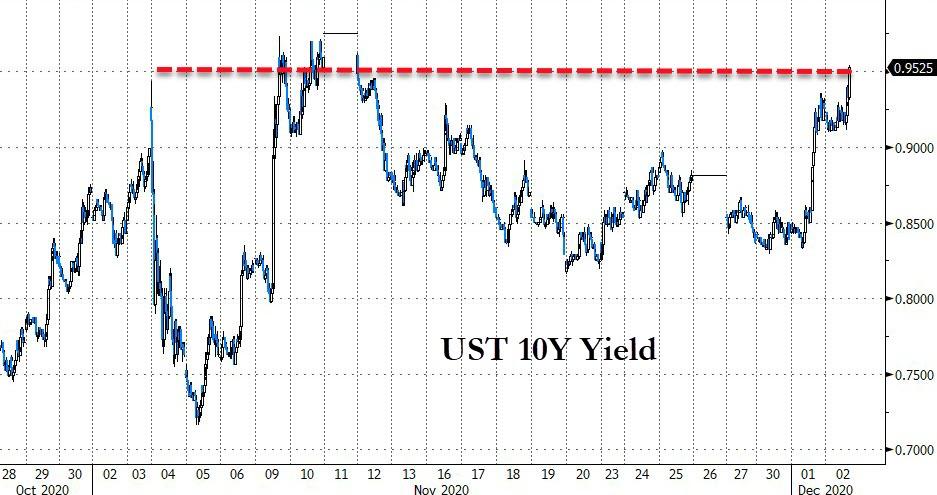
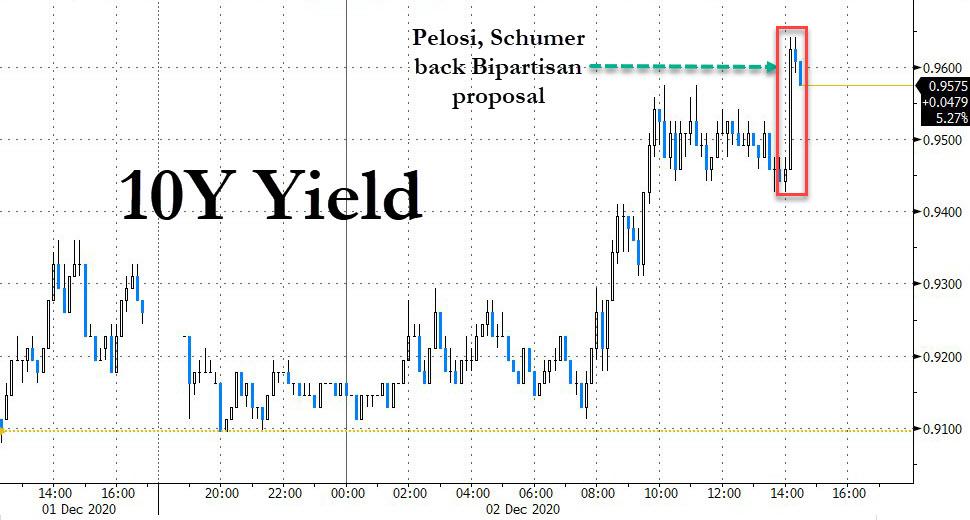
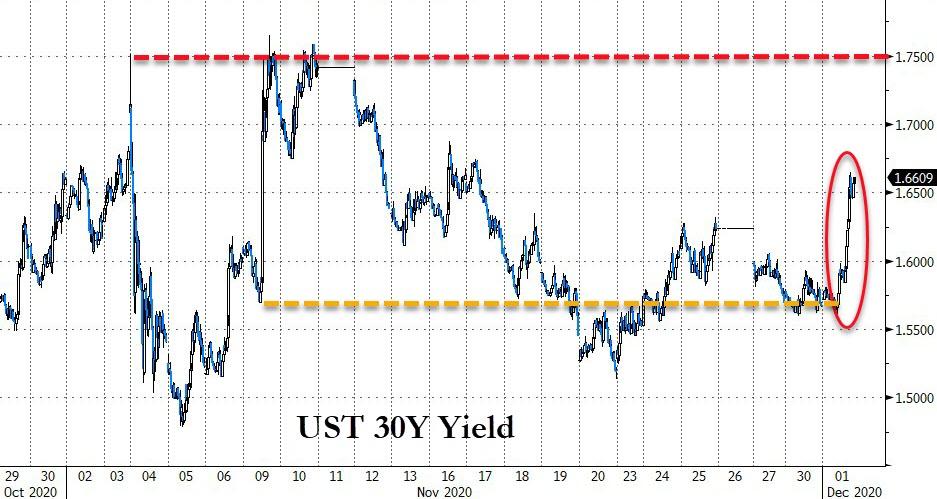
Bond yields dipped after Friday’s spike thereby alleviating fears, at least for the time being, that the 1% psychologically important ceiling might be broken to the upside, an event that could wreak havoc with equity markets.

Right now, that danger is not imminent, but it remains to be seen if there is enough bullish power left in the tank to drive the S&P 500 to its designated goal of 4,000, as some analysts seem to hope think.

Read More

ETFs On The Cutline – Updated Through 12/04/2020

Ulli ETFs on the Cutline Contact

Below, please find the latest High-Volume ETF Cutline report, which shows how far above or below their respective long-term trend lines (39-week SMA) my currently tracked ETFs are positioned.

This report covers the HV ETF Master List from Thursday’s StatSheet and includes 312 High Volume ETFs, defined as those with an average daily volume of more than $5 million, of which currently 285 (last week 285) are hovering in bullish territory. The yellow line separates those ETFs that are positioned above their trend line (%M/A) from those that have dropped below it.

Take a look:                                                                   

The HV ETF Master Cutline Report

In case you are not familiar with some of the terminology used in the reports, please read the Glossary of Terms. If you missed the original post about the Cutline approach, you can read it here.      

Weekly StatSheet For The ETF Tracker Newsletter – Updated Through 12/03/2020

Ulli ETF StatSheet Contact

ETF Data updated through Thursday, December 3, 2020

Methodology/Use of this StatSheet:

1. From the universe of over 1,800 ETFs, I have selected only those with a trading volume of over $5 million per day (HV ETFs), so that liquidity and a small bid/ask spread are assured.

2. Trend Tracking Indexes (TTIs)

Buy or Sell decisions for Domestic and International ETFs (section 1 and 2), are made based on the respective TTI and its position either above or below its long-term M/A (Moving Average). A crossing of the trend line from below accompanied by some staying power above constitutes a “Buy” signal. Conversely, a clear break below the line constitutes a “Sell” signal. Additionally, I use a 7.5% trailing stop loss on all positions in these categories to control downside risk.

3. All other investment arenas do not have a TTI and should be traded based on  the position of the individual ETF relative to its own respective trend line (%M/A). That’s why those signals are referred to as a “Selective Buy.” In other words, if an ETF crosses its own trendline to the upside, a “Buy” signal is generated. Since these areas tend to be more volatile, I recommend a wider trailing sell stop of 7.5% -10% depending on your risk tolerance.

If you are unfamiliar with some of the terminology, please see Glossary of Terms and new subscriber information in section 9.     

1. DOMESTIC EQUITY ETFs: BUY — since 07/22/2020

Click on chart to enlarge

Our main directional indicator, the Domestic Trend Tracking Index (TTI-green line in the above chart) has now rallied above its long-term trend line (red) by +21.47% and remains in “BUY” mode as posted.

Read More

Stimulus Optimism Boosts Equities

Ulli Market Commentary Contact

[Chart courtesy of MarketWatch.com]

  1. Moving the markets

With both warring parties looking to find common ground for a stimulus package, demands had been considerably dropped from the original over $2 trillion to a far more modest $907 billion. Optimism prevailed early on when a more comfortable number of $600 billion was circulated.

However, nothing was decided, but the markets were the beneficiaries nonetheless with the major indexes showing green numbers. But reality struck late in the day when Pfizer dialed back its vaccine rollout plan, as supply chain issues surfaced.

The S&P 500 immediately headed south and surrendered its gains but only closed moderately in the red, while the other two major indexes remained easily above their respective unchanged lines.   

On the economic front, we learned that initial jobless claims dropped this week but still showed a disappointing 712k new filings vs. expectations of 775k. Looking at the big picture, there are still over 20 million Americans filing weekly for some kind of unemployment benefit, according to ZH. That said, it appears that tomorrow’s payroll print may be disappointing.

The big assist for equites came from none other than the biggest short-squeeze since September, as Bloomberg pointed out in this chart. Added ZH:

Most shorted stocks are up 17 of the last 22 days, and up a stunning 35% since the start of November.

10-year Bond yields pulled back from their recent ascent towards the 1% level, at least for the time being. The US dollar continued its best imitation of a swan dive, thereby lending support to rising gold prices, which bounced off their 200-day M/A.  

I will be out of town tomorrow and won’t be able to write the market commentary, but I will post the “ETFs on the Cutline” on Saturday morning.

Read More

Looking For A Catalyst—And Finding It

Ulli Market Commentary Contact

[Chart courtesy of MarketWatch.com]

  1. Moving the markets

Expectations and reality were at odds this morning when the Labor Market Index weakened yet Bond yields spiked with the 10-year trading just above 0.95% and approaching critical resistance.

Sure, the weakening Labor Market Index was the result of the latest miss on ADP employment with data coming in at a disappointing 307k additions as opposed to 440k expected. But bond yields rising where they should have been falling makes me go “hmm,” and is just another sign of the upside-down world we’re living in.

The futures dropped, and the major indexes listlessly attempted to climb out of an early hole with traders ignoring the latest vaccine news, as it appeared that a new catalyst was needed to drive the markets.

The much-needed assist came via a mid-day headline that Pelosi and Schumer were backing a bipartisan $908 billion relief plan. That was enough to send bond yields soaring and equities rallying despite the counter parties Mnuchin and McConnell not having voiced any support.

But those details do not matter, stocks got their initial catalyst, and up we went with the S&P 500 eking out a record close. There was no broad participation with Small and MidCaps dropping, while GLD held up well in the face of rising rates by gaining +0.79%, a move that was supported by a falling US dollar.

In the end, the biggest threat to equities right now are rising bond yields. Should the 10-year cross the 1% level to the upside, I am pondering whether that will shorten the lifespan of the current bull and favor a return to bearish sentiment?

Read More

Storming Into December

Ulli Market Commentary Contact

[Chart courtesy of MarketWatch.com]

  1. Moving the markets

An early rally got cut down, especially in the Dow, but the major indexes managed to eke out solid gains to start the December by continuing the bullish theme of November. The S&P 500 and Nasdaq scored new record closing highs, but the Dow was not able to remain above its 30k level.

The US Dollar got slammed, which for a change helped gold to stage a rebound back above its recently lost $1,800 level. The victim from the dollar dump were bonds, which slipped as yields spiked severely with the 20-year ETF TLT losing -1.61%.

Market sentiment got a boost after the unveiling of a $908 billion stimulus plan, which assisted stocks early on and propelled the 10-year Treasury yield above 0.9%. However, all the hype evaporated, as the lawmakers engaged in their tug-of-war without any agreement, thereby continuing the stalemate.   

Hope that the rally has legs and will last through the end of the year flourishes:

“December looks like it will be a very strong finish for 2020,” wrote Tom Lee of Fundstrat Global Advisors, who cited data that showed during bull markets when the S&P 500 was up more than 10% through November for the year, it always added to that gain in December.

Only time will tell if history repeats itself.

Read More