
- Moving the markets
The futures markets were mixed due to fresh tensions between China and the U.S., with uncertainty rising as progress on the coronavirus relief bill was nowhere in sight.
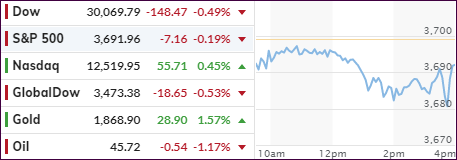
This theme carried into the regular session where two of the major indexes headed south and never crawled back out of the red zone. The Nasdaq diverged and solidly meandered above its unchanged line the entire time.
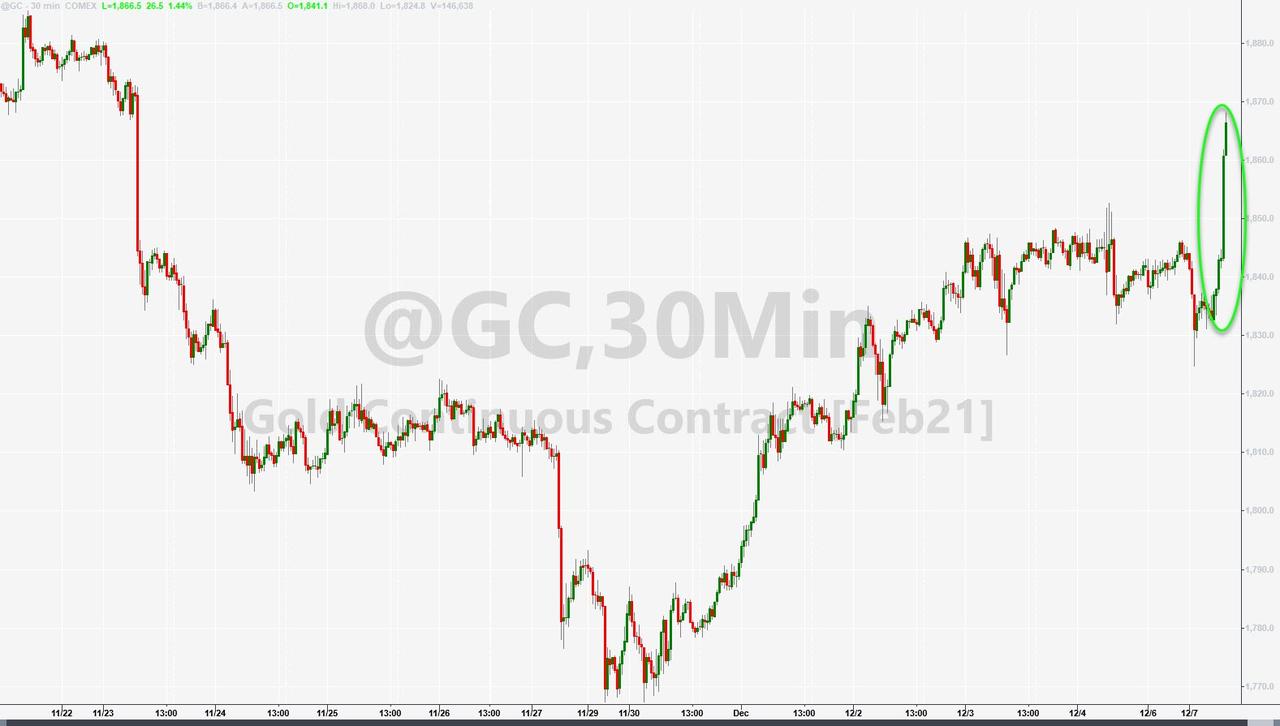
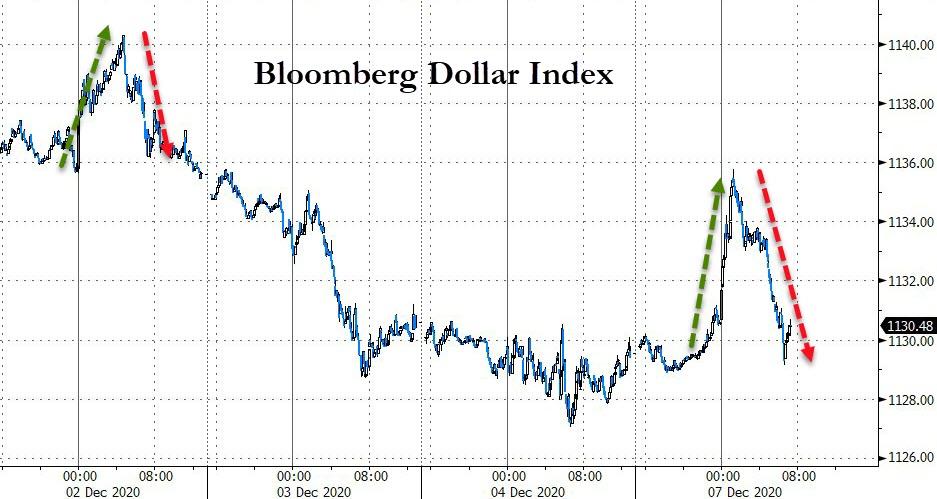
SmallCap Growth ETFs rallied as Value ETFs slipped. However, the dominant gainer was gold (GLD), which rebounded +1.47% and reclaimed its 200-day M/A. The US dollar index assisted by giving back much of an early bounce.
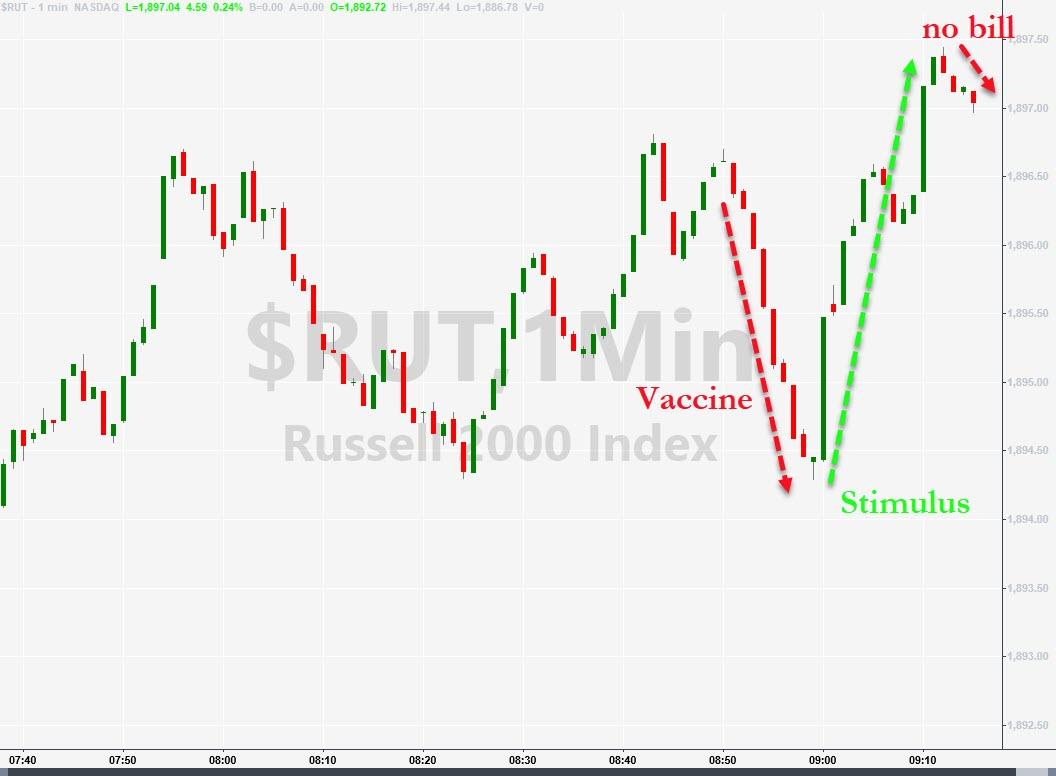
With Covid-19 related cases rising, calls for more stimulus have been increasing, but lawmakers are continuing to struggle with a solution. Additionally, government funding needs to be extended to buy more time to avoid a shutdown.
ZH posted these critical headlines:
- 1154ET: SOME STATES’ COVID VACCINE ESTIMATES USED OUTDATED FIGURES, STATE FIGURES ASSUMED MORE PFIZER SHOTS WOULD BE AVAILABLE”
- 1200ET: McConnell re-evaluating liability protection, to announce $900bn bill at 3pm
- 1215ET: McConnell will not be announcing bill at 3pm
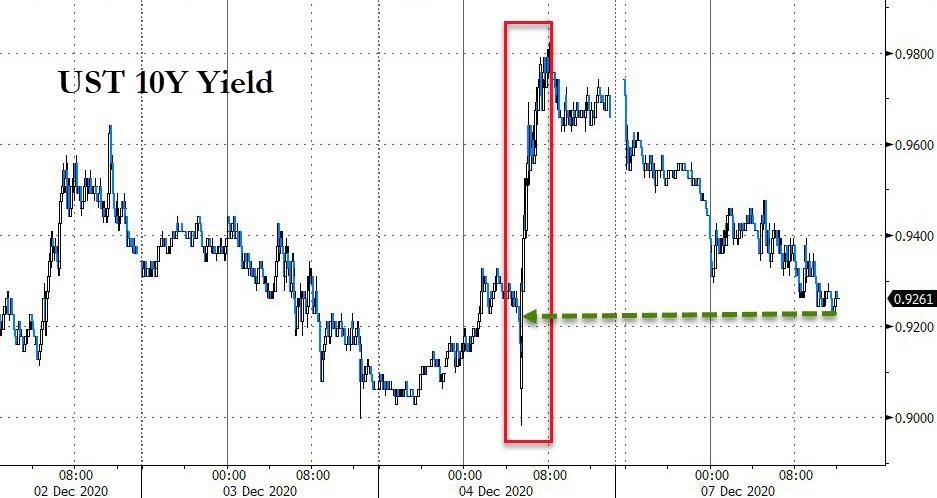
Bond yields dipped after Friday’s spike thereby alleviating fears, at least for the time being, that the 1% psychologically important ceiling might be broken to the upside, an event that could wreak havoc with equity markets.
Right now, that danger is not imminent, but it remains to be seen if there is enough bullish power left in the tank to drive the S&P 500 to its designated goal of 4,000, as some analysts seem to hope think.
2. ETFs in the Spotlight
In case you missed the announcement and description of this section, you can again.
It features some of the 10 broadly diversified domestic and sector ETFs from my HighVolume list as posted every Saturday. Furthermore, they are screened for the lowest MaxDD% number meaning they have been showing better resistance to temporary sell offs than all others over the past year.
The below table simply demonstrates the magnitude with which these ETFs are fluctuating above or below their respective individual trend lines (%+/-M/A). A break below, represented by a negative number, shows weakness, while a break above, represented by a positive percentage, shows strength.
For hundreds of ETF choices, be sure to reference Thursday’s StatSheet.
For this current domestic “Buy” cycle, here’s how some our candidates have fared:
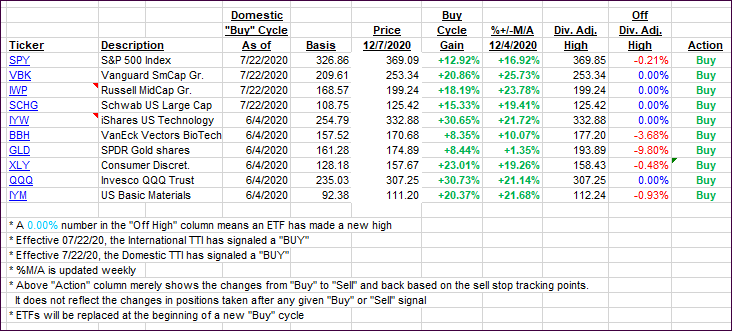
Click image to enlarge
Again, the %+/-M/A column above shows the position of the various ETFs in relation to their respective long-term trend lines, while the trailing sell stops are being tracked in the “Off High” column. The “Action” column will signal a “Sell” once the -8% point has been taken out in the “Off High” column. For more volatile sector ETFs, the trigger point is -10%.
3. Trend Tracking Indexes (TTIs)
Our TTIs faded as the markets presented a mixed picture.
This is how we closed 12/07/2020:
Domestic TTI: +22.02% above its M/A (prior close +22.63%)—Buy signal effective 07/22/2020
International TTI: +20.78% above its M/A (prior close +21.36%)—Buy signal effective 07/22/2020
Disclosure: I am obliged to inform you that I, as well as my advisory clients, own some of the ETFs listed in the above table. Furthermore, they do not represent a specific investment recommendation for you, they merely show which ETFs from the universe I track are falling within the specified guidelines.
Contact Ulli