Below, please find the latest High-Volume ETF Cutline report, which shows how far above or below their respective long-term trend lines (39-week SMA) my currently tracked ETFs are positioned.
This report covers the HV ETF Master List from Thursday’s StatSheet and includes 312 High Volume ETFs, defined as those with an average daily volume of more than $5 million, of which currently 278 (last week 279) are hovering in bullish territory. The yellow line separates those ETFs that are positioned above their trend line (%M/A) from those that have dropped below it.
In case you are not familiar with some of the terminology used in the reports, please read the Glossary of Terms. If you missed the original post about the Cutline approach, you can read it here.
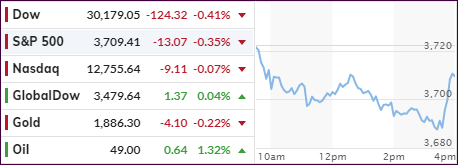
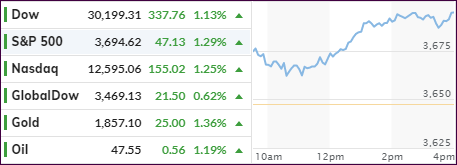
Quadruple witching day provided much volatility, but the fallout was barely worth mentioning with the major indexes slipping moderately but closing the week on the plus side of the ledger.
Added CNBC:
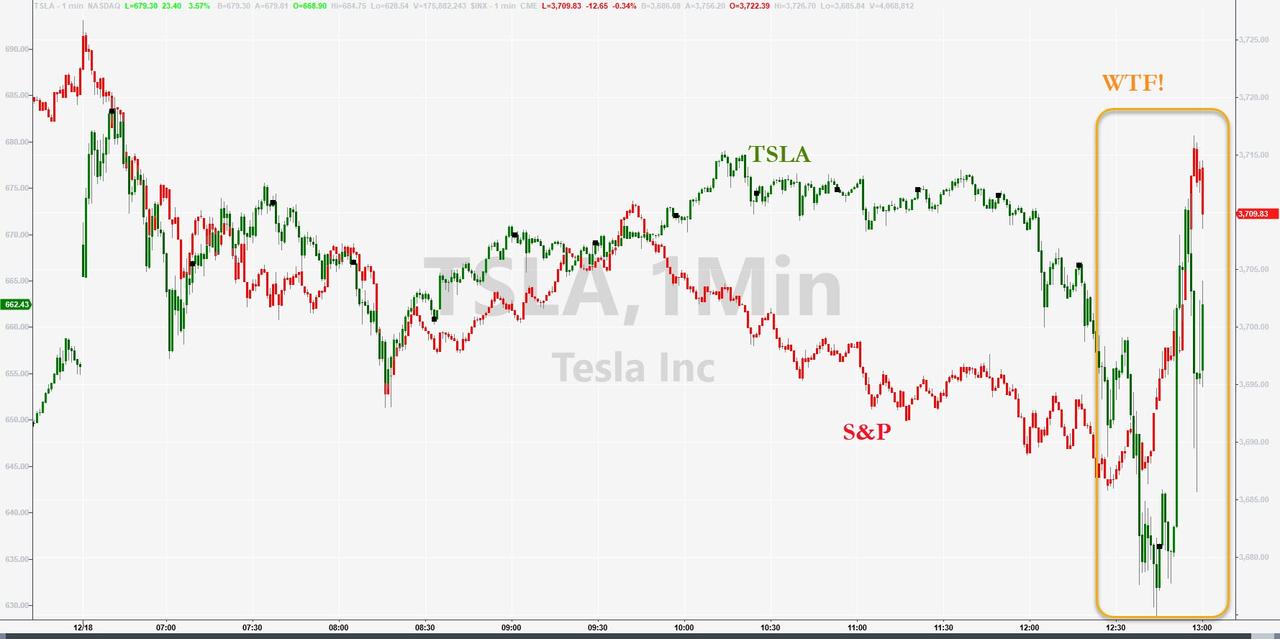
The stock market experienced massive volume on Friday as Tesla’s historic entry into the S&P 500 will be based on prices at the close. There will be a rush of activity into the final bell and the S&P 500 will begin trading with Tesla as a member on Monday.
While that sounds simple, we may see the markets display more violent swings, as the inclusion will have its challenges:
With a market capitalization of more than $600 billion after a 700% rally this year, the electric carmaker will be joining as the seventh-largest company in the index.
Tesla is being added to the benchmark in one fell swoop, marking the largest rebalancing of the S&P 500 in history. It’s estimated that passive funds tracking the S&P 500 will need to buy more than $85 billion of Tesla, while selling $85 billion of the rest of the index to make room for it.
In the latest vaccine news, we learned that the FDA overwhelmingly backed Moderna’s Covid product, which would be a key step towards public distribution approval. Some inoculations were already given with Pfizer’s vaccine.
Hope continues to reign supreme that the rising Covid cases in combination with disheartening econ data would push the warring factions in Washington into finalizing a new aid package. Discussions about the current proposed $900 billion plan are still ongoing, despite federal funding lapsing at 12:01 am EST on Saturday.
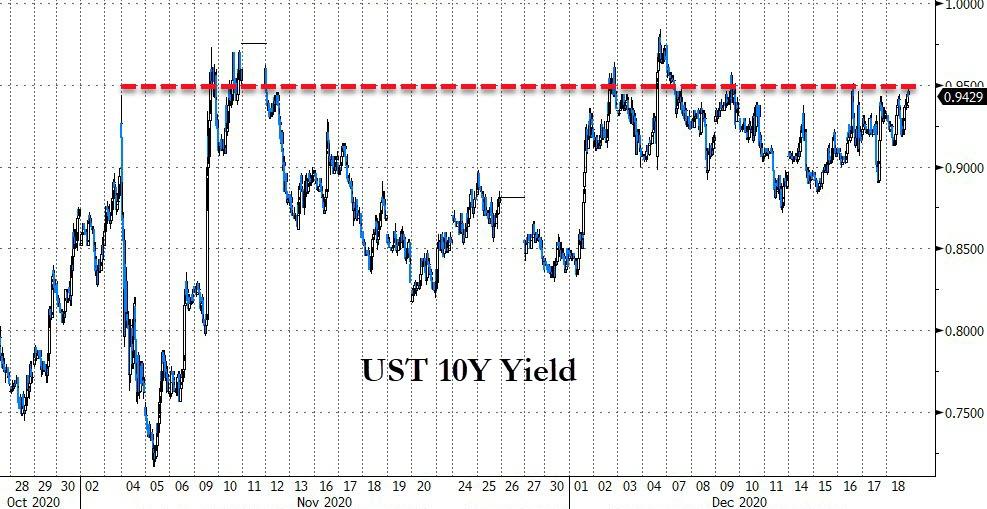
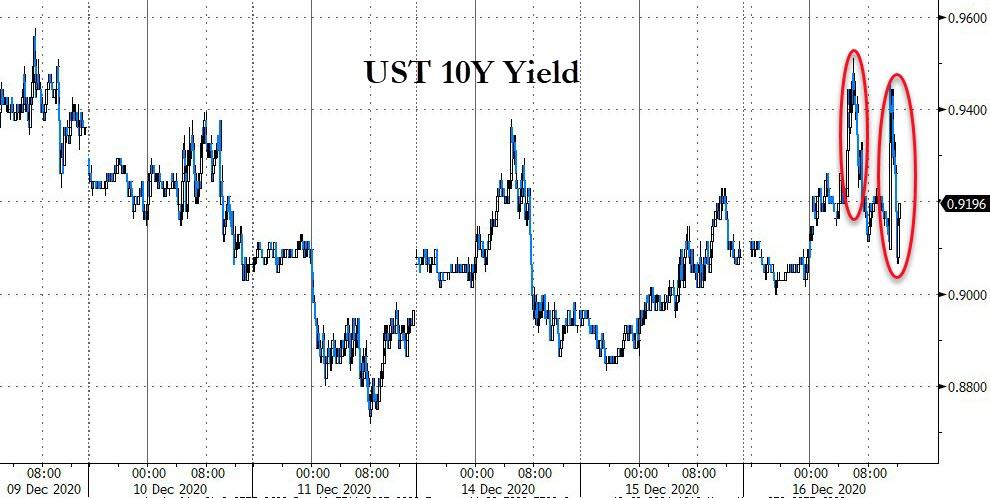
Small and MidCaps continued their ascent to higher levels, as weakness in the major indexes did not affect those sectors. 10-year bond yields spiked towards their overhead resistance level of 0.95%, however, should a solid break above that level occur in the future, equities will be negatively affected.
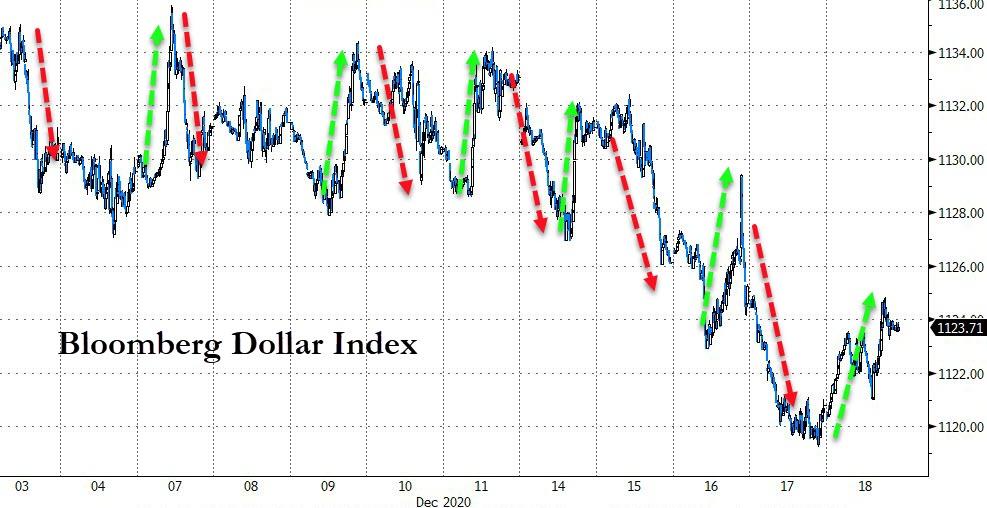
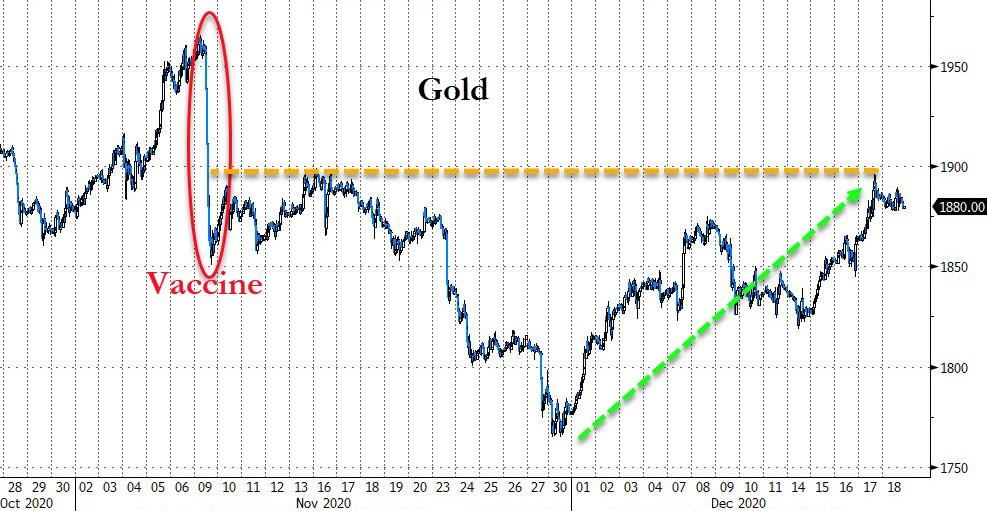
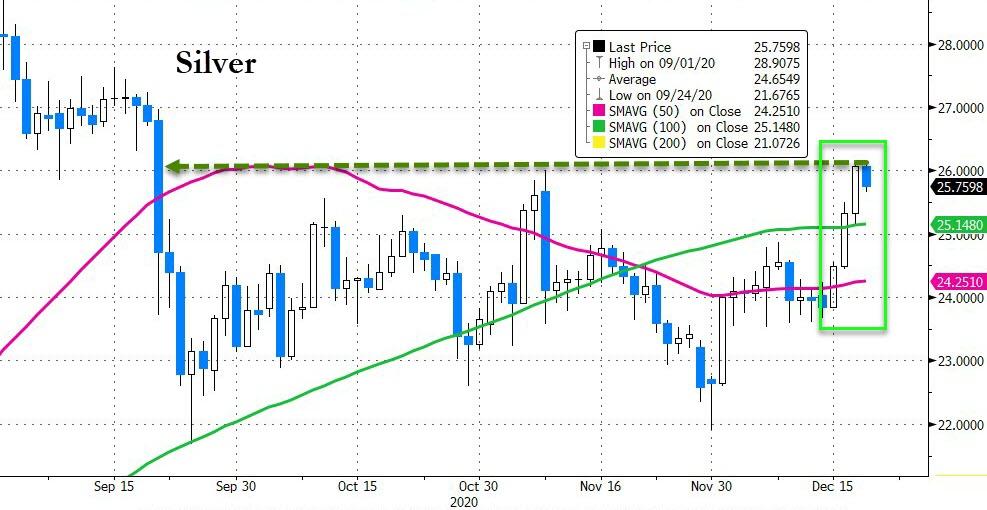
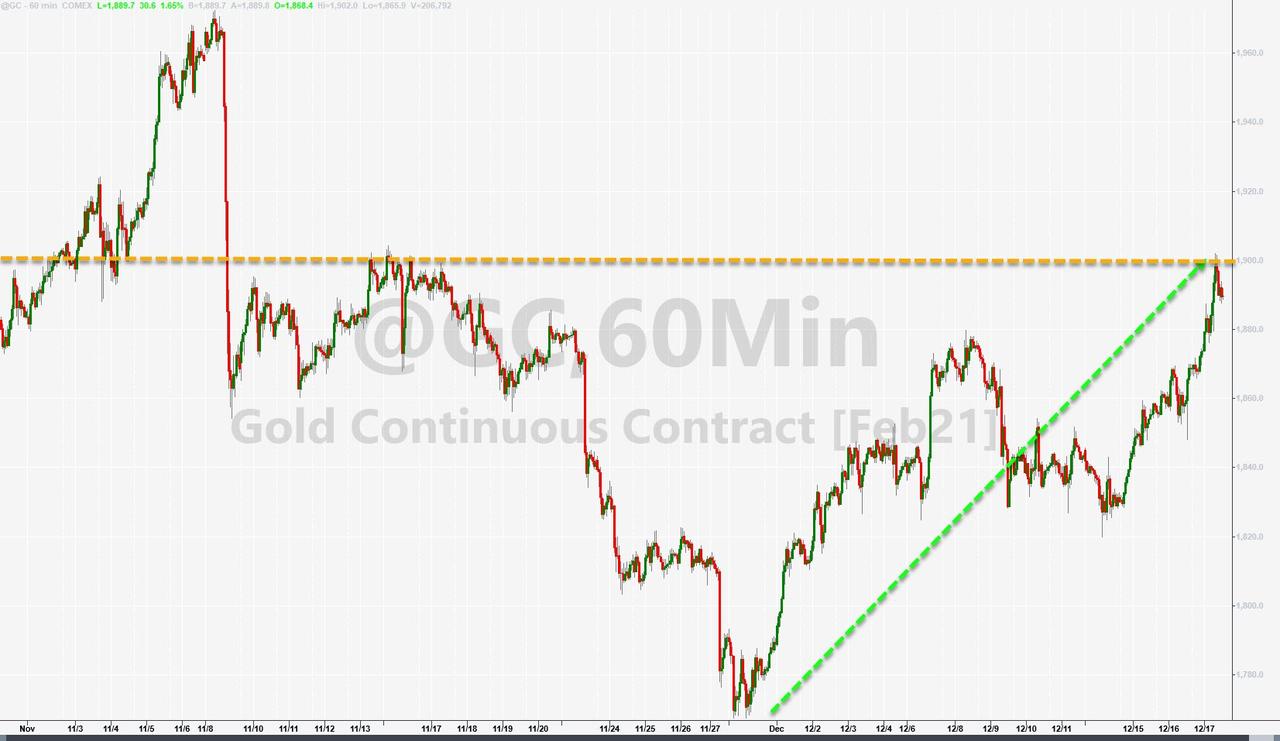
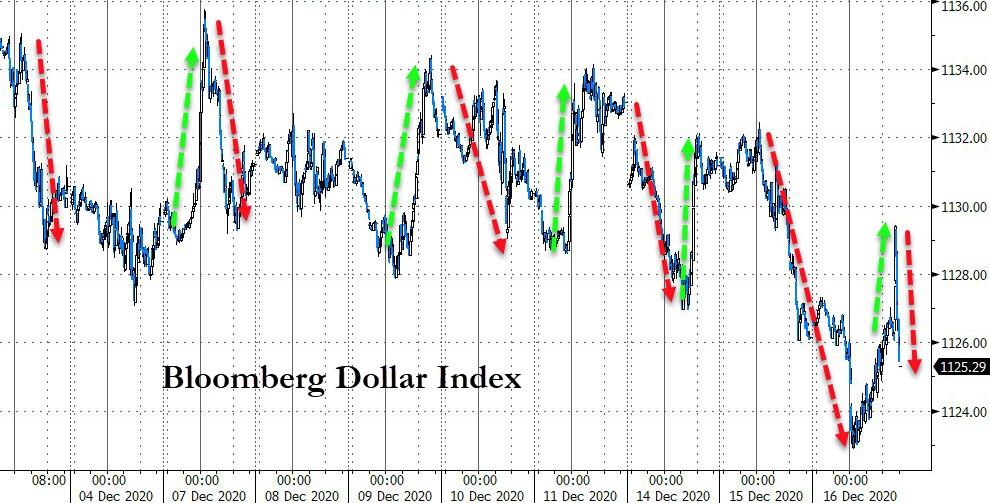
The US dollar resumed its zig-zagging path of December and managed to bounce off its low level, thereby taking some starch out of gold’s recent rebound. None of this impinged on silver, which broke back above its highest level in 3 months, as Bloomberg’s chart shows.
Again, the Tesla inclusion in the S&P index as of Monday will certainly create some havoc, but it looks like the current year-end rally will not be meaningfully interrupted.
ETF Data updated through Thursday, December 17, 2020
Methodology/Use of this StatSheet:
1. From the universe of over 1,800 ETFs, I have selected only those with a trading volume of over $5 million per day (HV ETFs), so that liquidity and a small bid/ask spread are assured.
2. Trend Tracking Indexes (TTIs)
Buy or Sell decisions for Domestic and International ETFs (section 1 and 2), are made based on the respective TTI and its position either above or below its long-term M/A (Moving Average). A crossing of the trend line from below accompanied by some staying power above constitutes a “Buy” signal. Conversely, a clear break below the line constitutes a “Sell” signal. Additionally, I use a 7.5% trailing stop loss on all positions in these categories to control downside risk.
3. All other investment arenas do not have a TTI and should be traded based on the position of the individual ETF relative to its own respective trend line (%M/A). That’s why those signals are referred to as a “Selective Buy.” In other words, if an ETF crosses its own trendline to the upside, a “Buy” signal is generated. Since these areas tend to be more volatile, I recommend a wider trailing sell stop of 7.5% -10% depending on your risk tolerance.
If you are unfamiliar with some of the terminology, please see Glossary of Termsand new subscriber information in section 9.
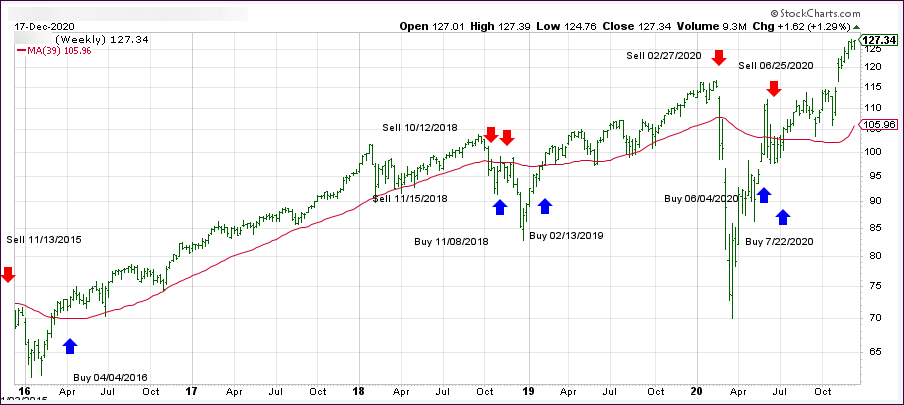
1. DOMESTIC EQUITY ETFs: BUY — since 07/22/2020
Click on chart to enlarge
Our main directional indicator, the Domestic Trend Tracking Index (TTI-green line in the above chart) has now rallied above its long-term trend line (red) by +21.76% and remains in “BUY” mode as posted.
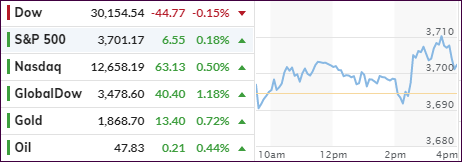
Traders and algos were in a buying mood based on continued hopes that a stimulus deal will be agreed upon before the end of 2020. This enthusiasm has been the main driver with congressional leaders homing in on a $900 billion package that would include direct payments to individuals.
Even worsening Initial Jobless Claims, which soared from an upwardly revised 862k to 885k, their highest in almost 4 months, could not dampen the spirit of the bulls who relentlessly pushed the indexes higher and into record territory. However, the dream of a V-shape recovery has long vanished, as more claims in the future will be a direct result of the widespread lockdowns.
Leading the charge today were SmallCaps (+1.65%), MidCaps (+1.61%) and GLD (+1.05%). The latter has been on a nice rebound as of late most likely due to ever growing concerns that reckless fiscal and monetary stimulus will wreak havoc with the US Dollar with the eventual result being runaway inflation.
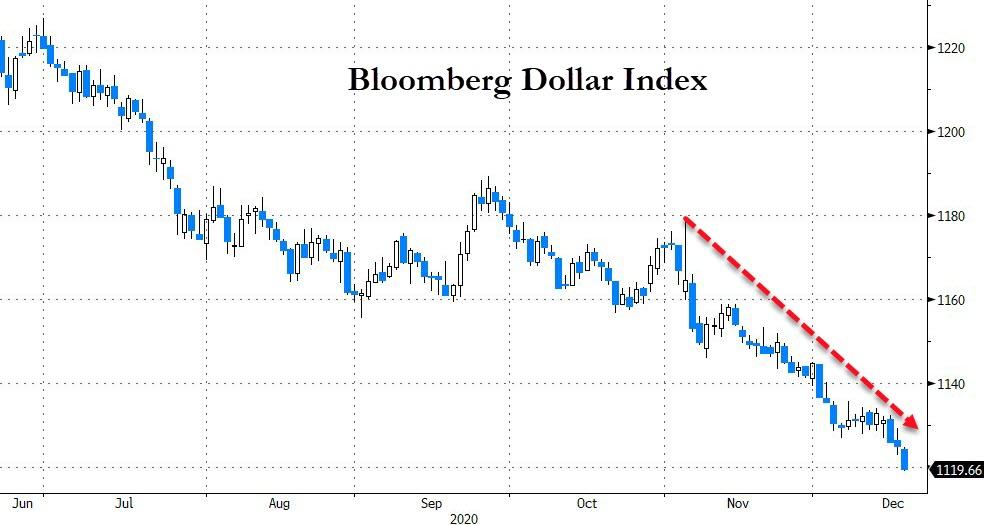
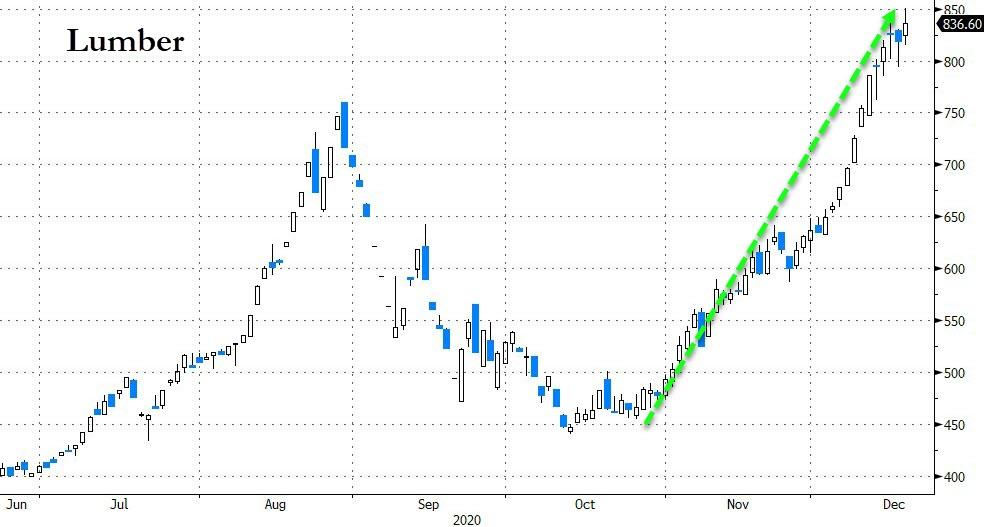
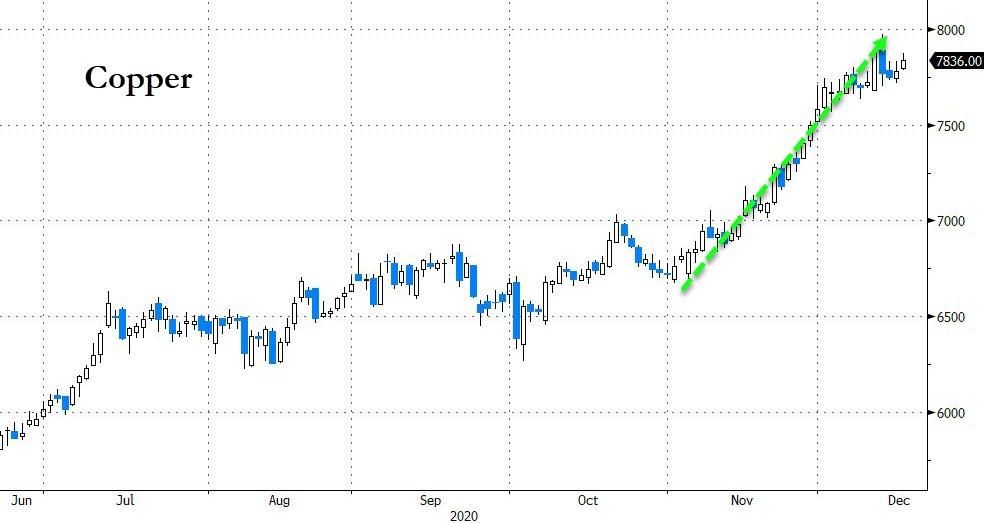
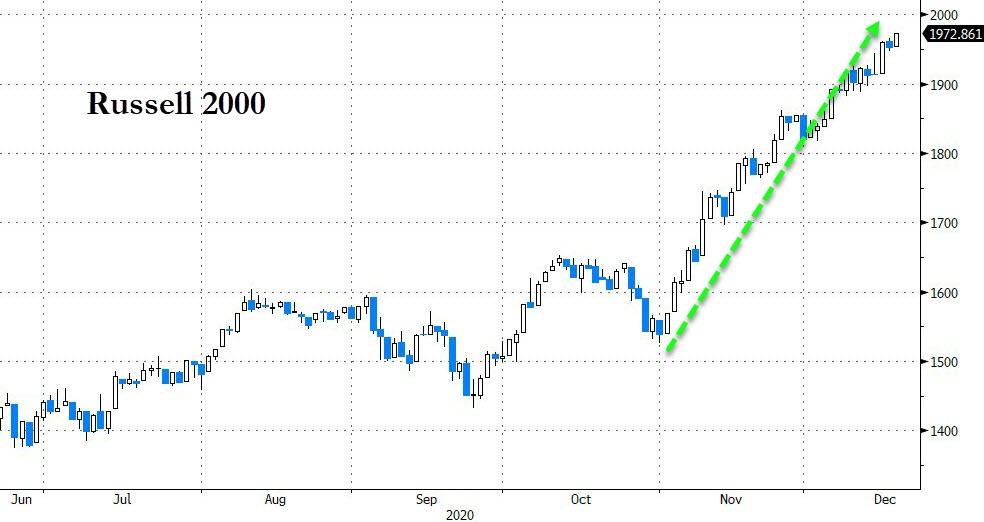
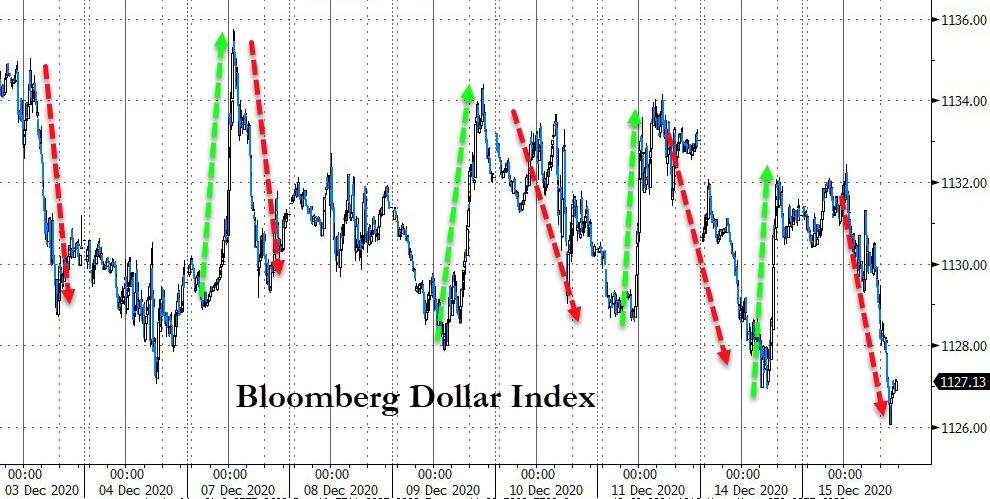
The US Dollar has now reached a point where it is at the verge of breaking down to its lowest in 6 years, which Bloomberg demonstrates in this chart. As ZH points out, the dollar dump has caused dollar-based assets to surge, such as lumber, copper, crude oil and, of course, the above mentioned SmallCaps.
It will be interesting to see, if these gains can hold up during tomorrow’s quadruple witching hour, during which some unintended volatility could occur due to Index Funds having to sell $50 billion of S&P to buy Tesla, which was just made part of the index.
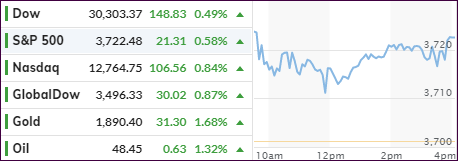
After some aimless meandering early on, the major indexes found some footing, because of Fed’s latest promise to keep supporting the economy with whatever means necessary.
Added CNBC:
The U.S. central bank said it will buy at least $120 billion of bonds each month “until substantial further progress has been made toward the Committee’s maximum employment and price stability goals.” The Fed declined to make any changes to the duration of its bond-buying program, but Chairman Jerome Powell said the central bank would increase its asset purchases if the economic recovery slows.
Also lending support to the afternoon ramp was apparent progress in the fiscal stimulus discussions:
“I’m optimistic that we’re going to be able to complete an understanding sometime soon,” McConnell said Tuesday night after the meeting. Schumer said the leaders are “making progress, and hopefully we can come to an agreement soon.”
Some weakness in the economy kept the afternoon rebound in check, as retail sales dropped -1.1% in November, which was considerably more than the expected -0.3% decline. I think we will see more weakness in future economic numbers simply because of the enhanced shutdowns and consistently high unemployment claims, both of which are an indication of a sputtering economy and not of one on a path to recovery.
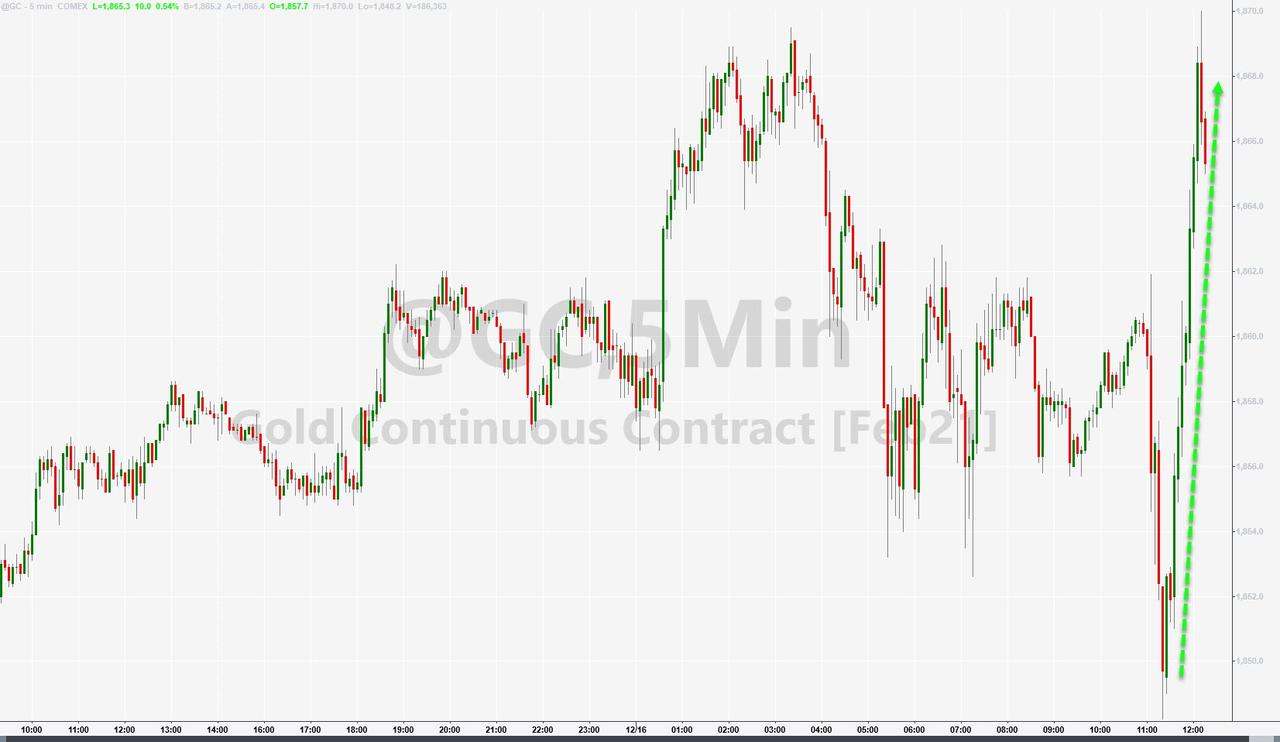
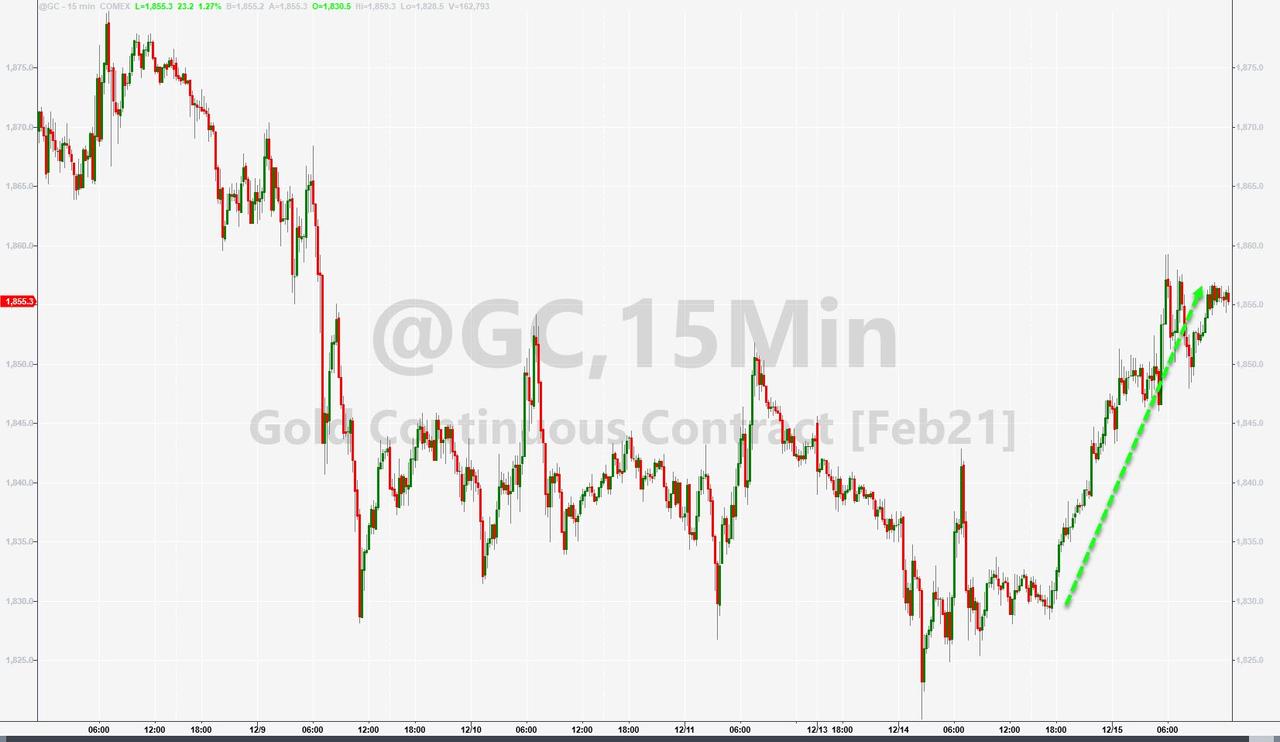
Bond yields took on a life of their own by pumping and dumping twice in a row but fading in the end, while the US Dollar index followed a similar pattern. On the equity side, the Nasdaq managed to outperform SmallCaps for the first time in a while. Gold zigzagged all day but spiked higher in the end.
This volatility is likely to continue, especially in the face of Friday’s upcoming quadruple witching hour.
Optimism reigned supreme that Congress will finally pass another economic relief bill after wrangling with it for weeks. Apparently, the warring parties are growing wary and concerned about an economic fallout if no agreement is being attained.
House Speaker Nancy Pelosi invited congressional leaders, including Senate Majority Mitch McConnell, to discuss government funding and coronavirus relief, a source told CNBC. Pelosi’s outreach came after a bipartisan group of lawmakers released a proposal for another round of economic relief on Monday evening, splitting a previous measure into two parts.
Just the mere fact that one party reached out to the other was enough of a reason for the computer algos to shift out of the stagnation mode of the past few days and into overdrive by propelling the major indexes solidly higher. While the stimulus deal is not done yet, it appears to have moved out of gridlock offering some solution to the widely held gloomy near-term outlook.
Though SmallCaps (IWO) led the ramp higher with a chest pounding +2.19% gain, the broad market participated as well and, thanks to the US Dollar collapsing, Gold had a great day by advancing +1.41%.
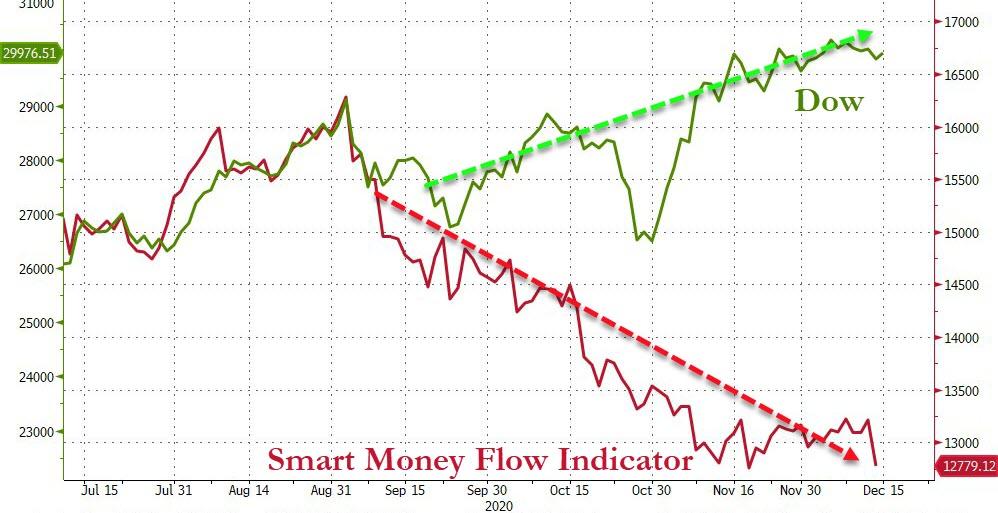
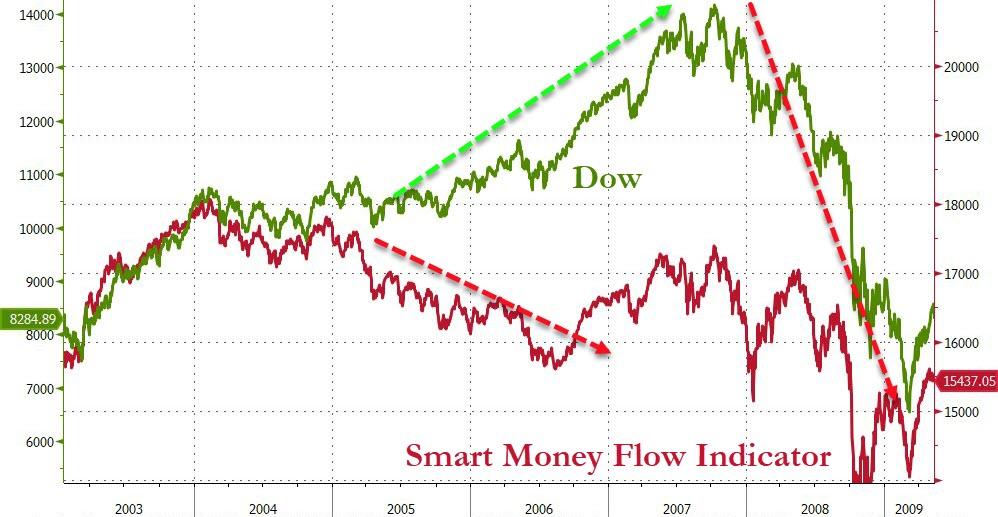
While all this sounds hunky dory, the Smart Money is not participating in this rally, as Bloomberg’s chart shows causing ZH to warn that last time things were so out of whack, this reversal happened.
While no one knows if it’s different this time, it’s wise to not only have an exit strategy in place but to also execute it, should the major trend hit the skids.

