
- Moving the markets
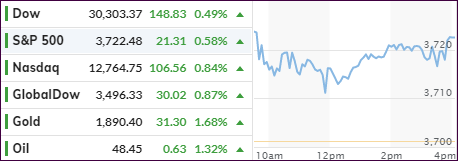
Traders and algos were in a buying mood based on continued hopes that a stimulus deal will be agreed upon before the end of 2020. This enthusiasm has been the main driver with congressional leaders homing in on a $900 billion package that would include direct payments to individuals.
Even worsening Initial Jobless Claims, which soared from an upwardly revised 862k to 885k, their highest in almost 4 months, could not dampen the spirit of the bulls who relentlessly pushed the indexes higher and into record territory. However, the dream of a V-shape recovery has long vanished, as more claims in the future will be a direct result of the widespread lockdowns.
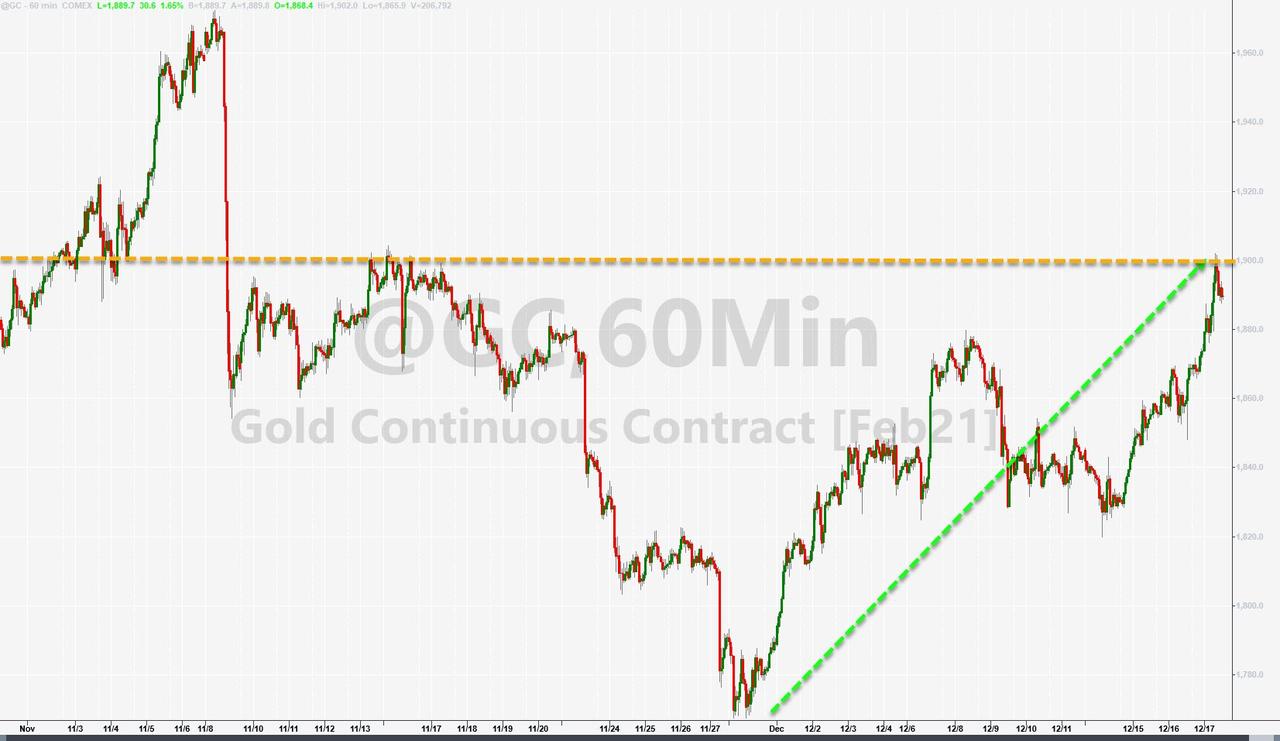
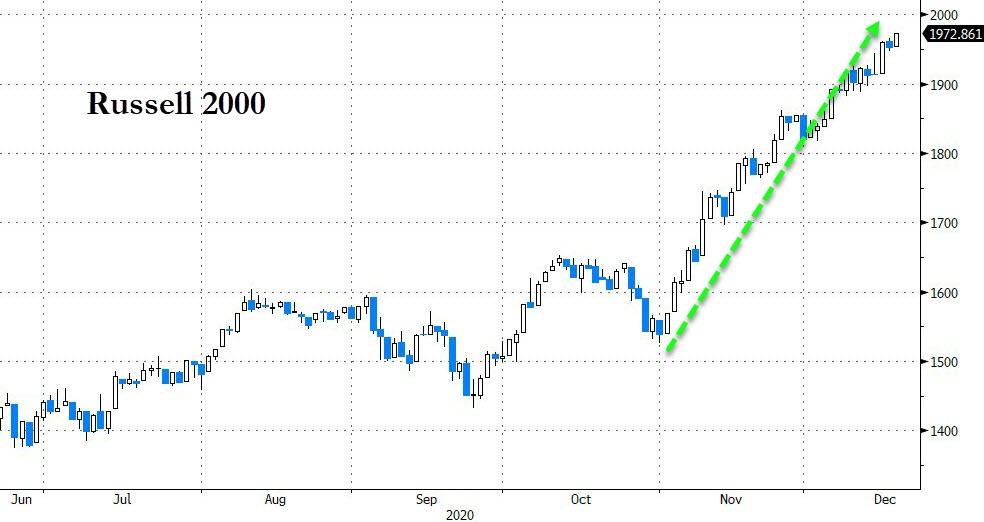
Leading the charge today were SmallCaps (+1.65%), MidCaps (+1.61%) and GLD (+1.05%). The latter has been on a nice rebound as of late most likely due to ever growing concerns that reckless fiscal and monetary stimulus will wreak havoc with the US Dollar with the eventual result being runaway inflation.
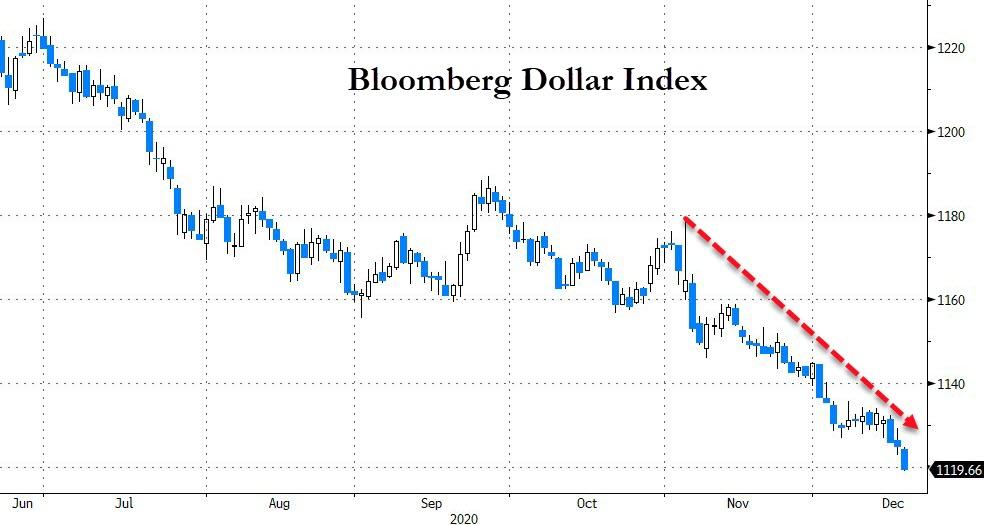
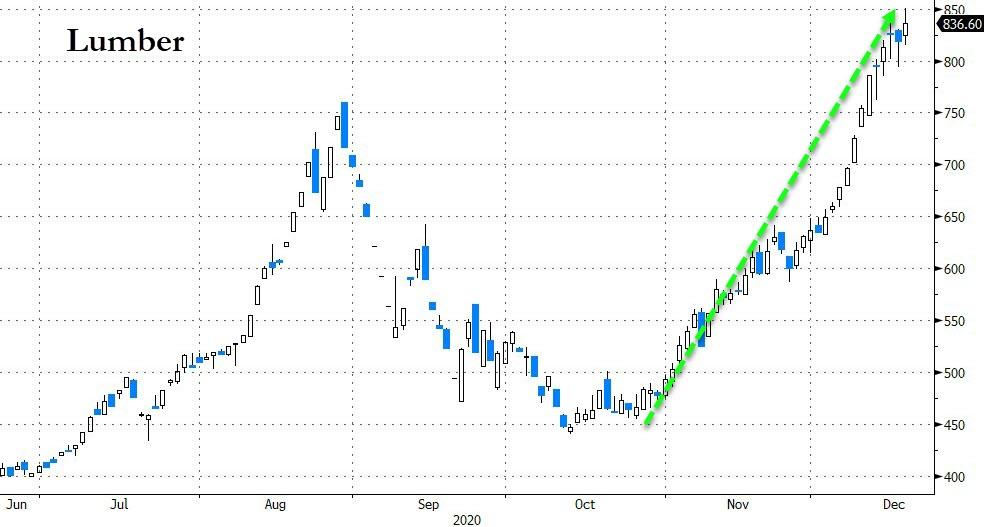
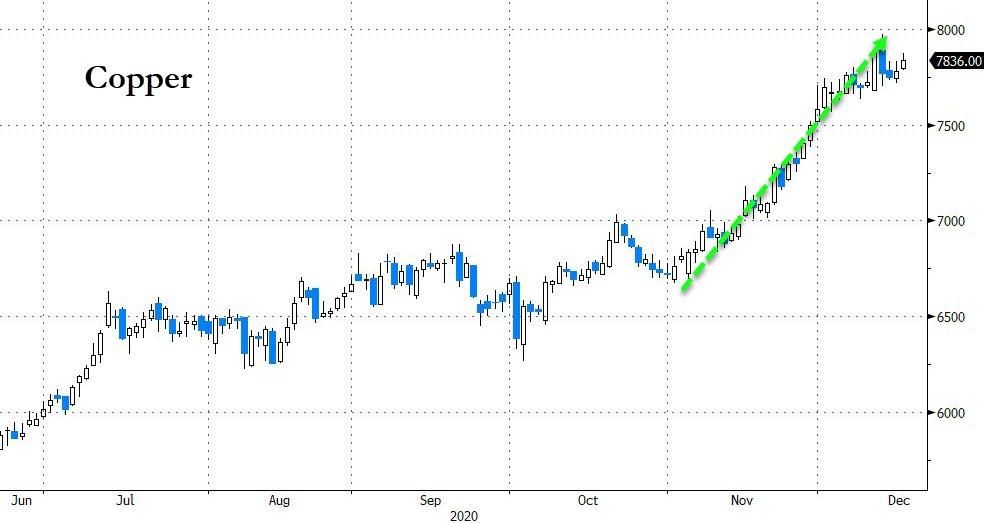
The US Dollar has now reached a point where it is at the verge of breaking down to its lowest in 6 years, which Bloomberg demonstrates in this chart. As ZH points out, the dollar dump has caused dollar-based assets to surge, such as lumber, copper, crude oil and, of course, the above mentioned SmallCaps.
It will be interesting to see, if these gains can hold up during tomorrow’s quadruple witching hour, during which some unintended volatility could occur due to Index Funds having to sell $50 billion of S&P to buy Tesla, which was just made part of the index.
2. ETFs in the Spotlight
In case you missed the announcement and description of this section, you can again.
It features some of the 10 broadly diversified domestic and sector ETFs from my HighVolume list as posted every Saturday. Furthermore, they are screened for the lowest MaxDD% number meaning they have been showing better resistance to temporary sell offs than all others over the past year.
The below table simply demonstrates the magnitude with which these ETFs are fluctuating above or below their respective individual trend lines (%+/-M/A). A break below, represented by a negative number, shows weakness, while a break above, represented by a positive percentage, shows strength.
For hundreds of ETF choices, be sure to reference Thursday’s StatSheet.
For this current domestic “Buy” cycle, here’s how some our candidates have fared:
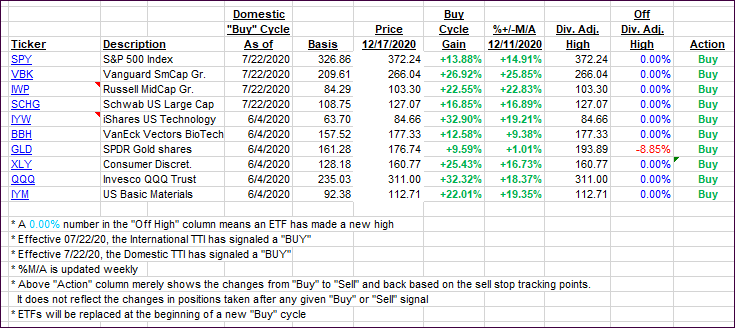
Click image to enlarge
Again, the %+/-M/A column above shows the position of the various ETFs in relation to their respective long-term trend lines, while the trailing sell stops are being tracked in the “Off High” column. The “Action” column will signal a “Sell” once the -8% point has been taken out in the “Off High” column. For more volatile sector ETFs, the trigger point is -10%.
3. Trend Tracking Indexes (TTIs)
Our TTIs headed north with the major indexes landing in record territory.
This is how we closed 12/17/2020:
Domestic TTI: +21.76% above its M/A (prior close +21.07%)—Buy signal effective 07/22/2020
International TTI: +20.53% above its M/A (prior close +19.93%)—Buy signal effective 07/22/2020
Disclosure: I am obliged to inform you that I, as well as my advisory clients, own some of the ETFs listed in the above table. Furthermore, they do not represent a specific investment recommendation for you, they merely show which ETFs from the universe I track are falling within the specified guidelines.
Contact Ulli