
- Moving the markets
Optimism reigned supreme that Congress will finally pass another economic relief bill after wrangling with it for weeks. Apparently, the warring parties are growing wary and concerned about an economic fallout if no agreement is being attained.
House Speaker Nancy Pelosi invited congressional leaders, including Senate Majority Mitch McConnell, to discuss government funding and coronavirus relief, a source told CNBC. Pelosi’s outreach came after a bipartisan group of lawmakers released a proposal for another round of economic relief on Monday evening, splitting a previous measure into two parts.
Just the mere fact that one party reached out to the other was enough of a reason for the computer algos to shift out of the stagnation mode of the past few days and into overdrive by propelling the major indexes solidly higher. While the stimulus deal is not done yet, it appears to have moved out of gridlock offering some solution to the widely held gloomy near-term outlook.
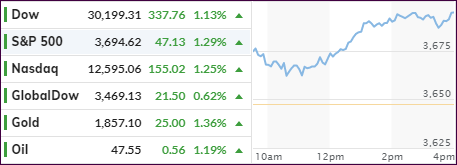
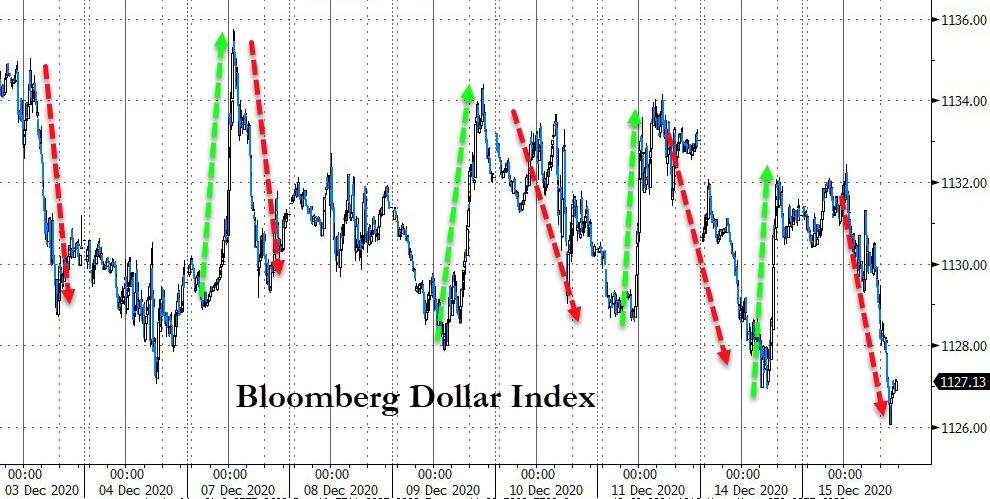
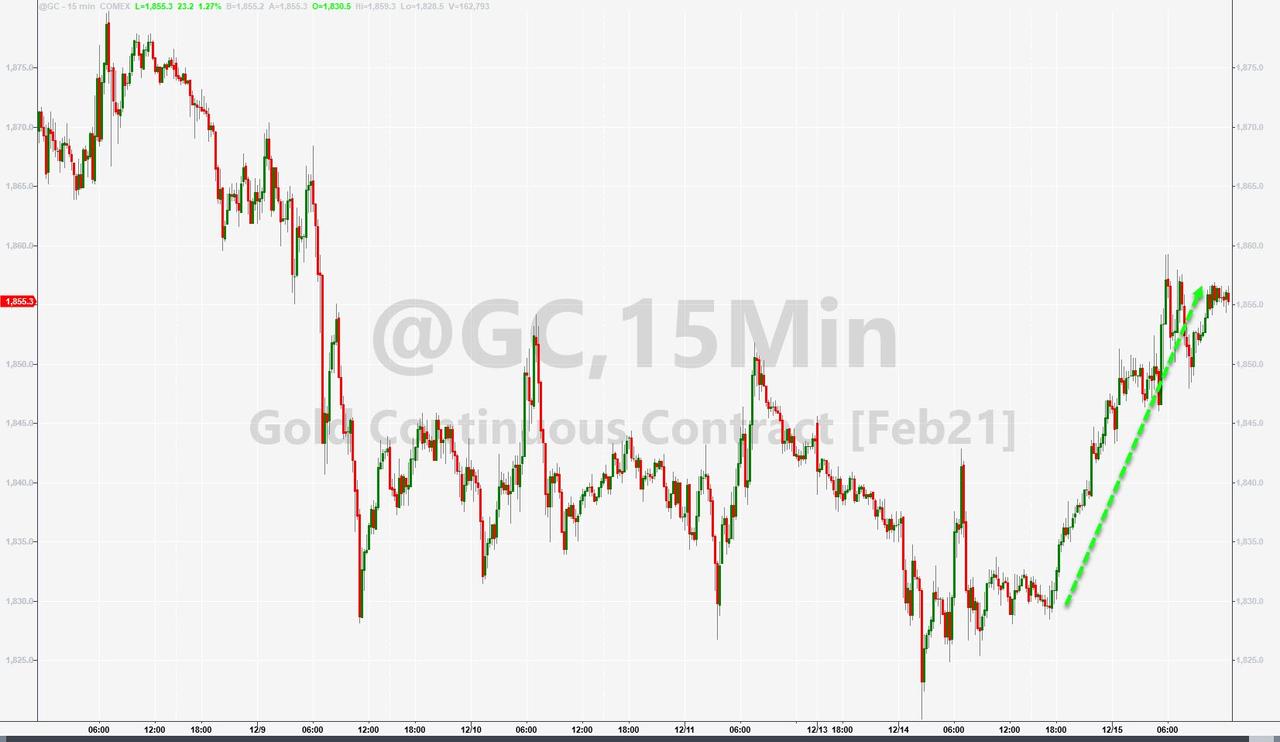
Though SmallCaps (IWO) led the ramp higher with a chest pounding +2.19% gain, the broad market participated as well and, thanks to the US Dollar collapsing, Gold had a great day by advancing +1.41%.
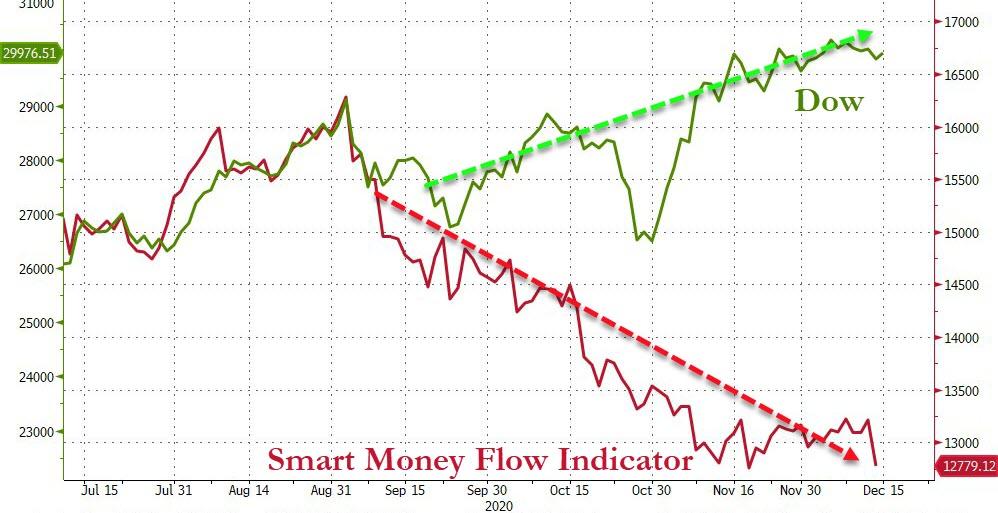
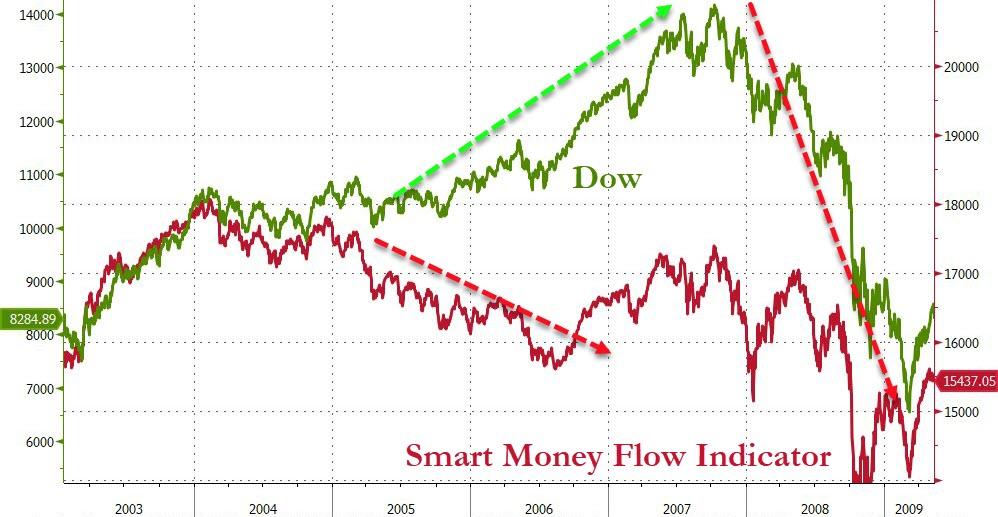
While all this sounds hunky dory, the Smart Money is not participating in this rally, as Bloomberg’s chart shows causing ZH to warn that last time things were so out of whack, this reversal happened.
While no one knows if it’s different this time, it’s wise to not only have an exit strategy in place but to also execute it, should the major trend hit the skids.
3. ETFs in the Spotlight
In case you missed the announcement and description of this section, you can again.
It features some of the 10 broadly diversified domestic and sector ETFs from my HighVolume list as posted every Saturday. Furthermore, they are screened for the lowest MaxDD% number meaning they have been showing better resistance to temporary sell offs than all others over the past year.
The below table simply demonstrates the magnitude with which these ETFs are fluctuating above or below their respective individual trend lines (%+/-M/A). A break below, represented by a negative number, shows weakness, while a break above, represented by a positive percentage, shows strength.
For hundreds of ETF choices, be sure to reference Thursday’s StatSheet.
For this current domestic “Buy” cycle, here’s how some our candidates have fared:
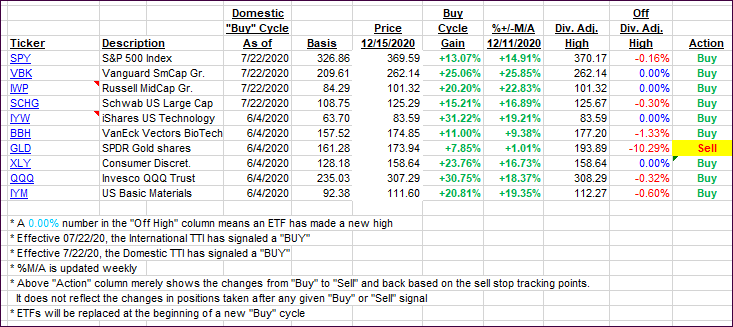
Click image to enlarge
Again, the %+/-M/A column above shows the position of the various ETFs in relation to their respective long-term trend lines, while the trailing sell stops are being tracked in the “Off High” column. The “Action” column will signal a “Sell” once the -8% point has been taken out in the “Off High” column. For more volatile sector ETFs, the trigger point is -10%.
3. Trend Tracking Indexes (TTIs)
Our TTIs recouped the losses of the past few days.
This is how we closed 12/15/2020:
Domestic TTI: +21.33% above its M/A (prior close +19.35%)—Buy signal effective 07/22/2020
International TTI: +19.58% above its M/A (prior close +18.59%)—Buy signal effective 07/22/2020
Disclosure: I am obliged to inform you that I, as well as my advisory clients, own some of the ETFs listed in the above table. Furthermore, they do not represent a specific investment recommendation for you, they merely show which ETFs from the universe I track are falling within the specified guidelines.
Contact Ulli