
- Moving the markets
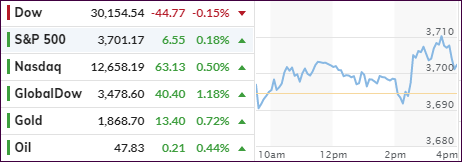
After some aimless meandering early on, the major indexes found some footing, because of Fed’s latest promise to keep supporting the economy with whatever means necessary.
Added CNBC:
The U.S. central bank said it will buy at least $120 billion of bonds each month “until substantial further progress has been made toward the Committee’s maximum employment and price stability goals.” The Fed declined to make any changes to the duration of its bond-buying program, but Chairman Jerome Powell said the central bank would increase its asset purchases if the economic recovery slows.
Also lending support to the afternoon ramp was apparent progress in the fiscal stimulus discussions:
“I’m optimistic that we’re going to be able to complete an understanding sometime soon,” McConnell said Tuesday night after the meeting. Schumer said the leaders are “making progress, and hopefully we can come to an agreement soon.”
Some weakness in the economy kept the afternoon rebound in check, as retail sales dropped -1.1% in November, which was considerably more than the expected -0.3% decline. I think we will see more weakness in future economic numbers simply because of the enhanced shutdowns and consistently high unemployment claims, both of which are an indication of a sputtering economy and not of one on a path to recovery.
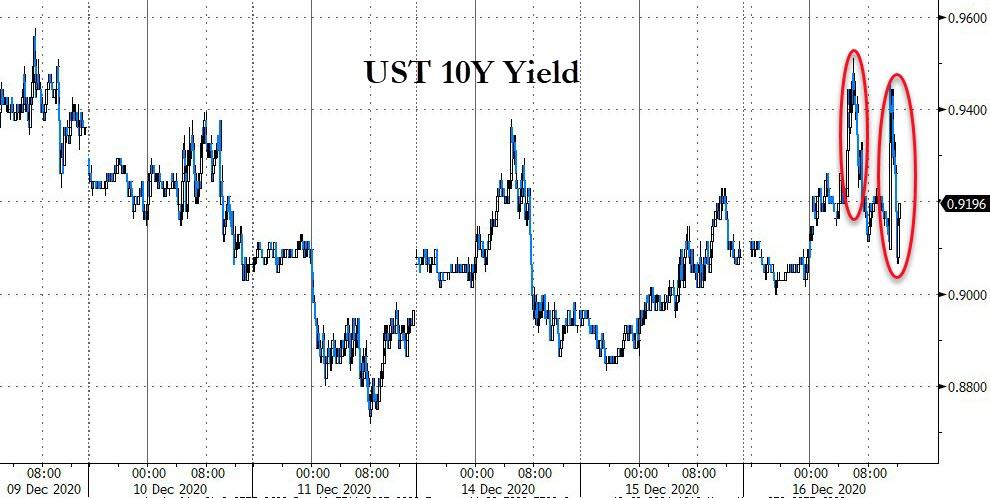
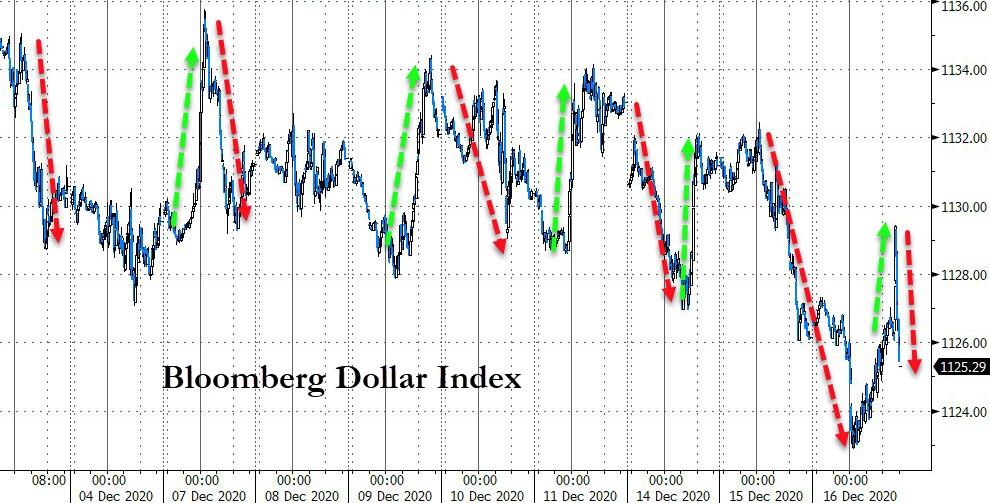
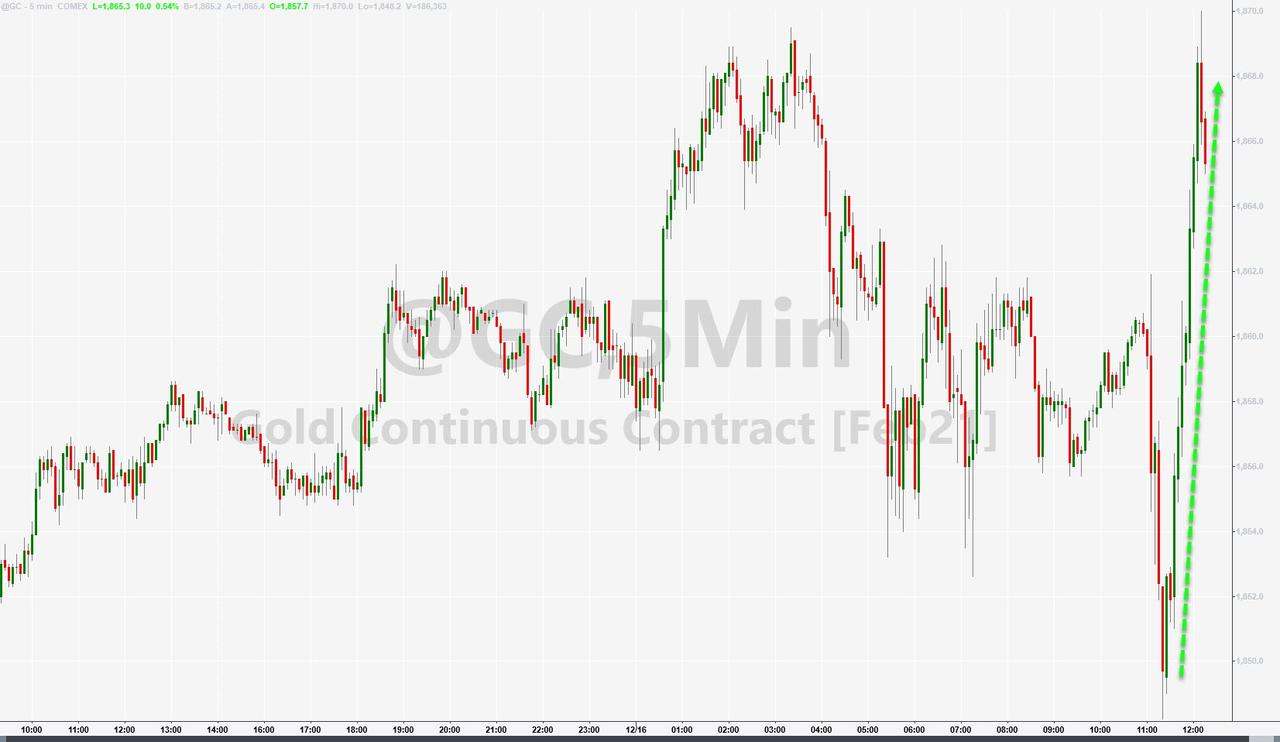
Bond yields took on a life of their own by pumping and dumping twice in a row but fading in the end, while the US Dollar index followed a similar pattern. On the equity side, the Nasdaq managed to outperform SmallCaps for the first time in a while. Gold zigzagged all day but spiked higher in the end.
This volatility is likely to continue, especially in the face of Friday’s upcoming quadruple witching hour.
2. ETFs in the Spotlight
In case you missed the announcement and description of this section, you can again.
It features some of the 10 broadly diversified domestic and sector ETFs from my HighVolume list as posted every Saturday. Furthermore, they are screened for the lowest MaxDD% number meaning they have been showing better resistance to temporary sell offs than all others over the past year.
The below table simply demonstrates the magnitude with which these ETFs are fluctuating above or below their respective individual trend lines (%+/-M/A). A break below, represented by a negative number, shows weakness, while a break above, represented by a positive percentage, shows strength.
For hundreds of ETF choices, be sure to reference Thursday’s StatSheet.
For this current domestic “Buy” cycle, here’s how some our candidates have fared:
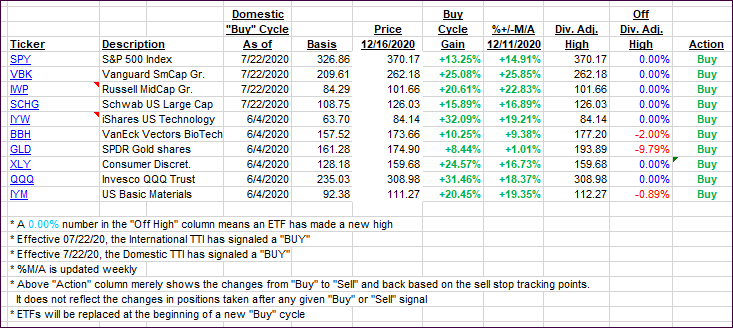
Click image to enlarge
Again, the %+/-M/A column above shows the position of the various ETFs in relation to their respective long-term trend lines, while the trailing sell stops are being tracked in the “Off High” column. The “Action” column will signal a “Sell” once the -8% point has been taken out in the “Off High” column. For more volatile sector ETFs, the trigger point is -10%.
3. Trend Tracking Indexes (TTIs)
Our TTIs were mixed and changed only irrelevantly.
This is how we closed 12/16/2020:
Domestic TTI: +21.07% above its M/A (prior close +21.33%)—Buy signal effective 07/22/2020
International TTI: +19.93% above its M/A (prior close +19.58%)—Buy signal effective 07/22/2020
Disclosure: I am obliged to inform you that I, as well as my advisory clients, own some of the ETFs listed in the above table. Furthermore, they do not represent a specific investment recommendation for you, they merely show which ETFs from the universe I track are falling within the specified guidelines.
Contact Ulli