Battling For The Unchanged Line

Ulli Market Commentary Contact

[Chart courtesy of MarketWatch.com]

  1. Moving the markets

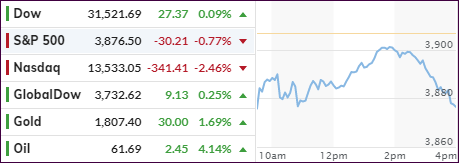
Despite a bullish theme in last night’s futures session, the regular one saw the bears take over, and the major indexes opened to the downside, just as we’ve seen recently. The remainder of the trading day was spent climbing out of that early hole with only the Dow managing to get back to even.

The S&P 500 and Nasdaq failed with the latter getting hit hard and closing at the lows of the day, which does not bode well for tomorrow’s opening.

Added CNBC:

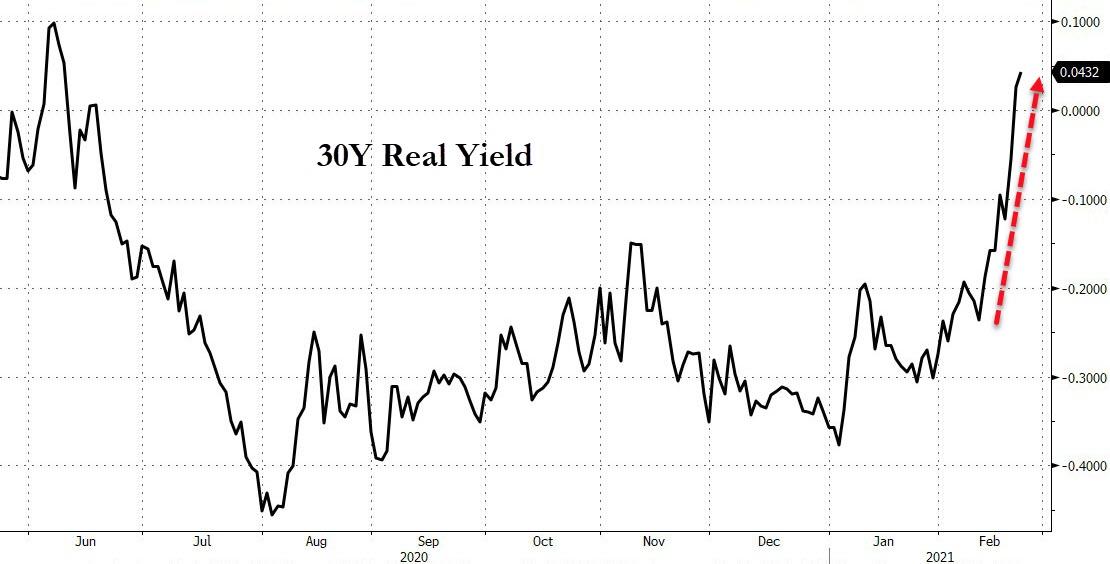
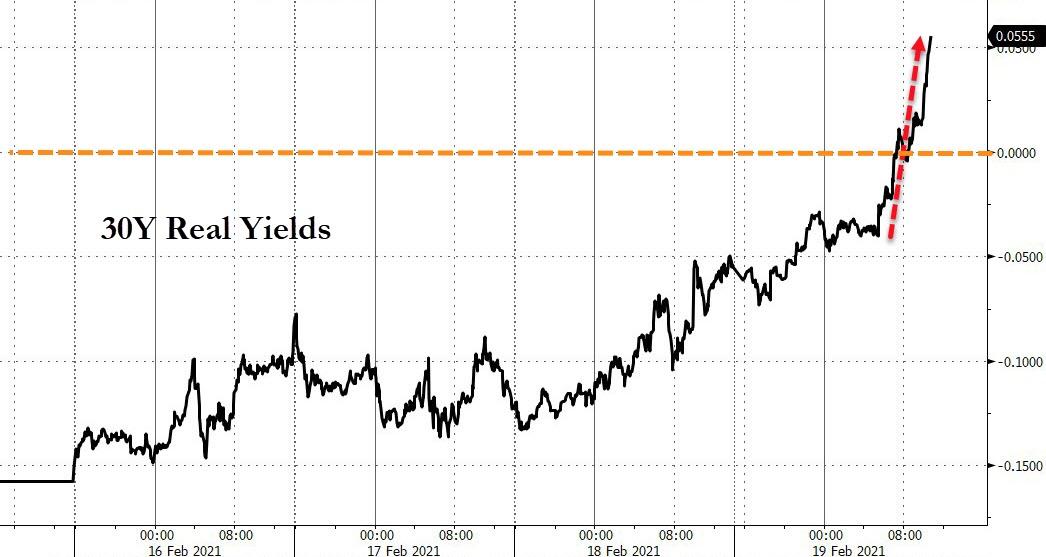
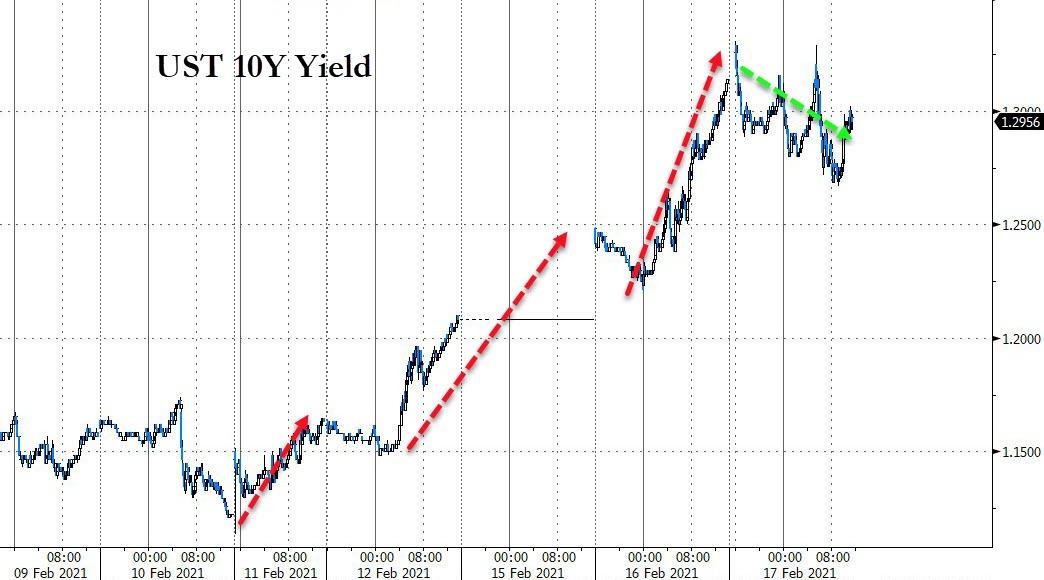
The 10-year Treasury yield rose again on Monday to around 1.36% after jumping 14 basis points last week to its highest level since February 2020. So far this month, the benchmark rate has moved up 27 basis points. The 30-year yield touched a one-year high of 2.2% Monday.

As I pointed out several times, the direction of bond yields will either support or punish equities. Right now, the trend is higher, which reduces traders’ appetite for stocks, especially in the tech sector, as big names got pressured today.

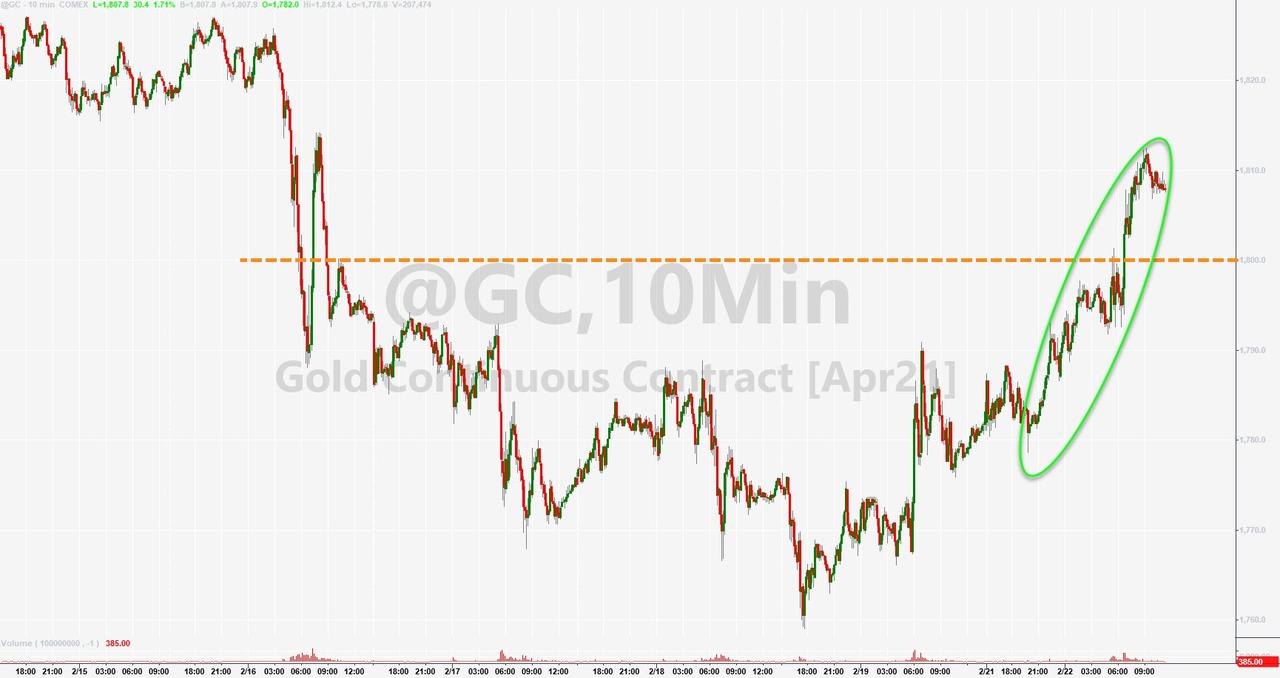
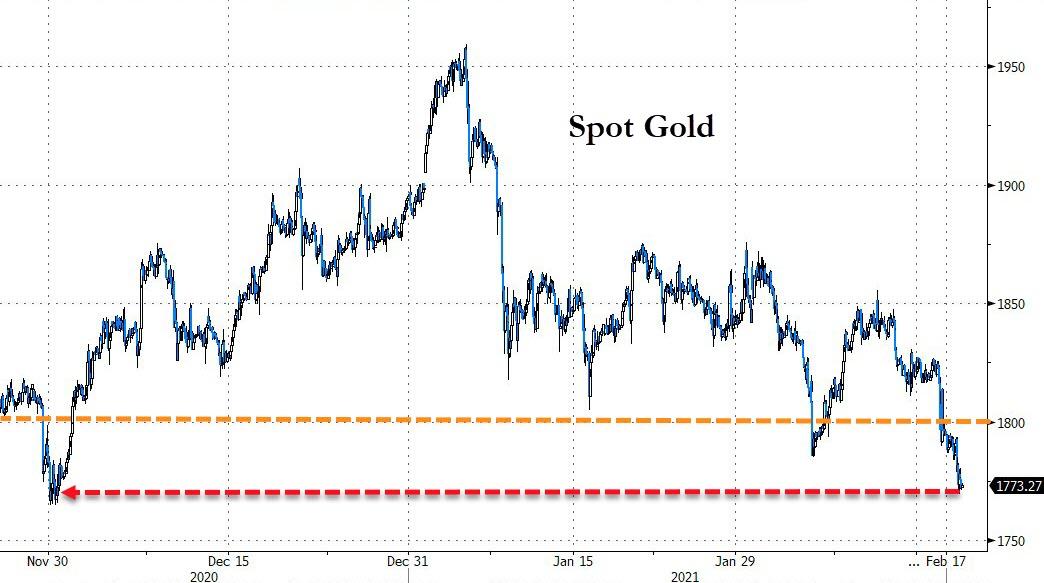
The reason is that fast high-growth tech companies, which rely on easy borrowing terms, could get hurt, and that is what we saw today. The good news was that Gold had a strong showing with +1.69%, which offset some of the tech losses.

On the other hand, some traders believe that the jump in bond yields simply reflects growing confidence in the nascent economic recovery by arguing that stocks should be able to absorb higher rates due to increased earnings.

Despite this current weakness, the markets have produced solid gains for the month, with the Dow and S&P having added around 5% and the Nasdaq +4.5%. SmallCaps have maintained their leadership with a solid +9.6%.

Let’s see if these numbers can hold up during the final 4 trading days.

Read More

ETFs On The Cutline – Updated Through 02/19/2021

Ulli ETFs on the Cutline Contact

Below, please find the latest High-Volume ETF Cutline report, which shows how far above or below their respective long-term trend lines (39-week SMA) my currently tracked ETFs are positioned.

This report covers the HV ETF Master List from Thursday’s StatSheet and includes 312 High Volume ETFs, defined as those with an average daily volume of more than $5 million, of which currently 258 (last week 265) are hovering in bullish territory. The yellow line separates those ETFs that are positioned above their trend line (%M/A) from those that have dropped below it.

Take a look:                                                                   

The HV ETF Master Cutline Report

In case you are not familiar with some of the terminology used in the reports, please read the Glossary of Terms. If you missed the original post about the Cutline approach, you can read it here.

ETF Tracker Newsletter For February 19, 2021

Ulli ETF Tracker Contact

ETF Tracker StatSheet          

You can view the latest version here.

AN EARLY RALLY BITES THE DUST—AGAIN

[Chart courtesy of MarketWatch.com]

  1. Moving the markets

Today resembled just how the week went for the major indexes. Early rallies lost steam, and this session was no exception, with the indexes ending the day at their respective unchanged lines. Overall, the pullback was modest with the S&P 500 surrendering -0.71% since last Friday.

A mix of rising interest rates (higher inflation), and some profit taking in the tech sector, dampened early enthusiasm and turned this session into a non-event. Bucking the pullback were SmallCaps (IWO), which catapulted higher by +2.08%, with MidCaps (IWP) joining in by rising +0.71%. Even Gold (GLD) withstood higher bond yields and added +0.42%.

CNBC chimed in like this:

The strength among economically sensitive stocks came after Treasury Secretary Janet Yellen told CNBC Thursday after the bell that more stimulus is necessary even as some economic data suggested a rebound is already underway. She added a $1.9 trillion stimulus deal could help the U.S. get back to full employment in a year.

The direction of bond yields will be the key component affecting the stock market trend. The 10-year Treasury yield rose to the highest in almost a year, and today added another 5 basis points to 1.34%. Some analysts think that if the 1.50% level is breached, this equity bull run will be in serious jeopardy.

One look at this chart shows what happened to the S&P 500 last time yields rocketed higher. This graph (ZH/Bloomberg) demonstrates that 30-year yields have surged the most since March 2020.

For sure, we will see an increase in volatility next week, as options expirations are on deck, an event that can spook markets and create uncertainty about future direction. Of course, should that happen, rest assured that the powers to be (Fed) will step in to placate the nervous nellies to restore calm, order, and bullishness.

And that sums up the kind of environment we are in.  

Read More

Weekly StatSheet For The ETF Tracker Newsletter – Updated Through 02/18/2021

Ulli ETF StatSheet Contact

ETF Data updated through Thursday, February 18, 2021

Methodology/Use of this StatSheet:

1. From the universe of over 1,800 ETFs, I have selected only those with a trading volume of over $5 million per day (HV ETFs), so that liquidity and a small bid/ask spread are assured.

2. Trend Tracking Indexes (TTIs)

Buy or Sell decisions for Domestic and International ETFs (section 1 and 2), are made based on the respective TTI and its position either above or below its long-term M/A (Moving Average). A crossing of the trend line from below accompanied by some staying power above constitutes a “Buy” signal. Conversely, a clear break below the line constitutes a “Sell” signal. Additionally, I use a 7.5% trailing stop loss on all positions in these categories to control downside risk.

3. All other investment arenas do not have a TTI and should be traded based on the position of the individual ETF relative to its own respective trend line (%M/A). That’s why those signals are referred to as a “Selective Buy.” In other words, if an ETF crosses its own trendline to the upside, a “Buy” signal is generated. Since these areas tend to be more volatile, I recommend a wider trailing sell stop of 7.5%-10% depending on your risk tolerance.

If you are unfamiliar with some of the terminology, please see Glossary of Terms and new subscriber information in section 9.     

1. DOMESTIC EQUITY ETFs: BUY — since 07/22/2020

Click on chart to enlarge

Our main directional indicator, the Domestic Trend Tracking Index (TTI-green line in the above chart) has now rallied above its long-term trend line (red) by +17.99% and remains in “BUY” mode as posted.

Read More

No Market Commentary

Ulli Uncategorized Contact

I am stuck in a meeting and won’t be able to write today’s commentary. However, I will post the latest StatSheet by 6:30 pm PST.

Ulli…

Climbing Out Of A Hole

Ulli Uncategorized Contact

[Chart courtesy of MarketWatch.com]

  1. Moving the markets

An early dump was reversed, especially by the Dow, which erased a 150-point loss and ended in the green by some 90 points, or +0.29%. The S&P 500 attempted the same magic but fell short, while the Nasdaq was the loser of the day with -0.58%, which was a major improvement from its lows of the session.

In the current non-directional environment, due to the ongoing rise in bond yields, highfliers like Small- and MidCaps are suffering the most.

Giving the markets an assist mid-day was none other than the Fed, after the release of the minutes of their last meeting suggested that easy monetary policy will remain in place for longer due to the economy being nowhere close to pre-pandemic readings.

“Participants noted that economic conditions were currently far from the Committee’s longer-run goals and that the stance for policy would need to remain accommodative until those goals were achieved,” the minutes stated.

On the economic front, we saw some surprises. Retail Sales surged by +5.3% MoM in January, quite a difference from expectations of a +1.1% increase. Industrial Production turned out better than anticipated, however, the data showed it still being down almost 2% YoY.

Bond yields spiked several times but lost some momentum into the close, as Bloomberg shows. As yields surged, gold and equities got dragged down with the latter finding some upward momentum late in the day. The US Dollar index built on yesterday’s gains and made sure precious metals had no chance of digging themselves out of an early hole.

As I pointed out yesterday, rising bond yields will be the biggest opposing force to keep equities in check, which is why I watch this arena very closely.  

Read More