
- Moving the markets
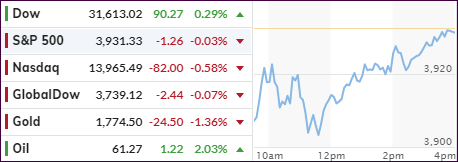
An early dump was reversed, especially by the Dow, which erased a 150-point loss and ended in the green by some 90 points, or +0.29%. The S&P 500 attempted the same magic but fell short, while the Nasdaq was the loser of the day with -0.58%, which was a major improvement from its lows of the session.
In the current non-directional environment, due to the ongoing rise in bond yields, highfliers like Small- and MidCaps are suffering the most.
Giving the markets an assist mid-day was none other than the Fed, after the release of the minutes of their last meeting suggested that easy monetary policy will remain in place for longer due to the economy being nowhere close to pre-pandemic readings.
“Participants noted that economic conditions were currently far from the Committee’s longer-run goals and that the stance for policy would need to remain accommodative until those goals were achieved,” the minutes stated.
On the economic front, we saw some surprises. Retail Sales surged by +5.3% MoM in January, quite a difference from expectations of a +1.1% increase. Industrial Production turned out better than anticipated, however, the data showed it still being down almost 2% YoY.
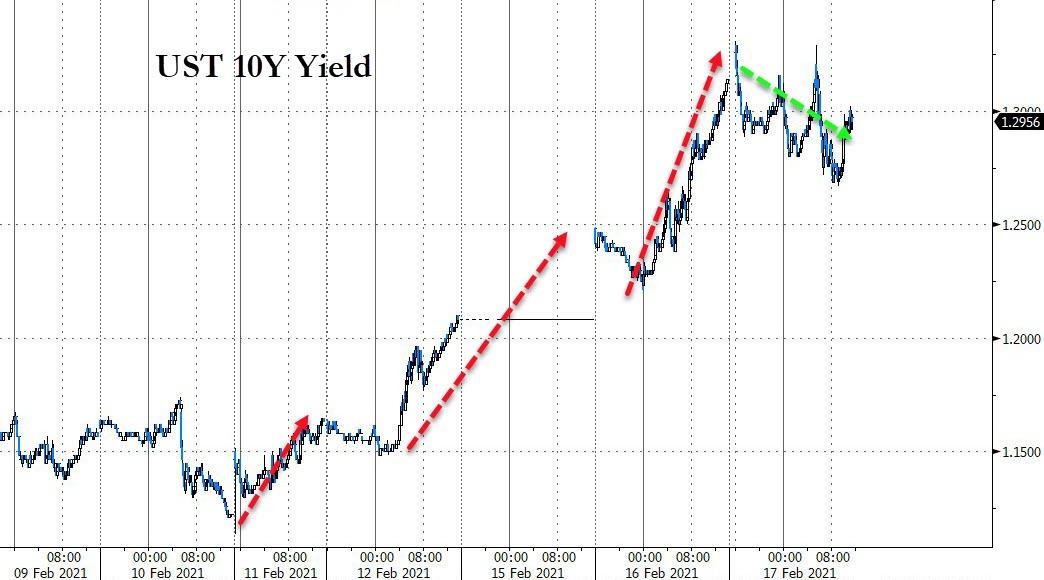
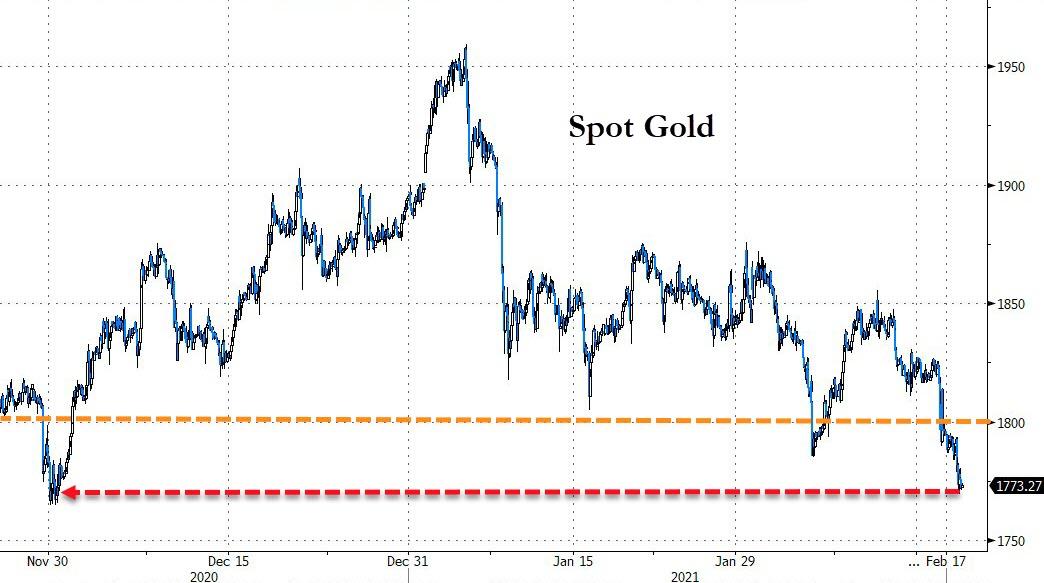
Bond yields spiked several times but lost some momentum into the close, as Bloomberg shows. As yields surged, gold and equities got dragged down with the latter finding some upward momentum late in the day. The US Dollar index built on yesterday’s gains and made sure precious metals had no chance of digging themselves out of an early hole.
As I pointed out yesterday, rising bond yields will be the biggest opposing force to keep equities in check, which is why I watch this arena very closely.
2. ETFs in the Spotlight
In case you missed the announcement and description of this section, you can read it here again.
It features some of the 10 broadly diversified domestic and sector ETFs from my HighVolume list as posted every Saturday. Furthermore, they are screened for the lowest MaxDD% number meaning they have been showing better resistance to temporary sell offs than all others over the past year.
The below table simply demonstrates the magnitude with which these ETFs are fluctuating above or below their respective individual trend lines (%+/-M/A). A break below, represented by a negative number, shows weakness, while a break above, represented by a positive percentage, shows strength.
For hundreds of ETF choices, be sure to reference Thursday’s StatSheet.
For this current domestic “Buy” cycle, here’s how some our candidates have fared:
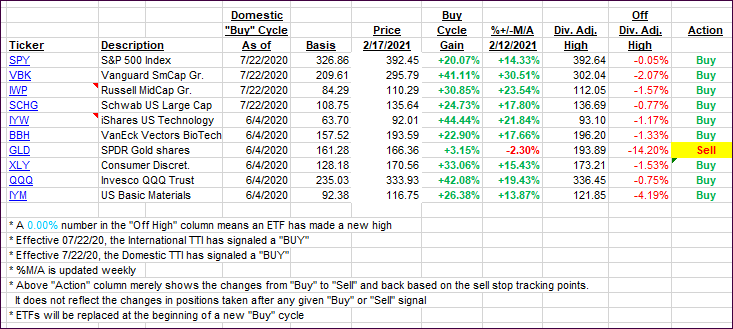
Click image to enlarge.
Again, the %+/-M/A column above shows the position of the various ETFs in relation to their respective long-term trend lines, while the trailing sell stops are being tracked in the “Off High” column. The “Action” column will signal a “Sell” once the -8% point has been taken out in the “Off High” column. For more volatile sector ETFs, the trigger point is -10%.
3. Trend Tracking Indexes (TTIs)
Our TTIs barely changed as riding a roller coaster was the manner of the day.
This is how we closed 2/17/2021:
Domestic TTI: +18.66% above its M/A (prior close +18.72%)—Buy signal effective 07/22/2020.
International TTI: +18.99% above its M/A (prior close +18.95%)—Buy signal effective 07/22/2020.
Disclosure: I am obliged to inform you that I, as well as my advisory clients, own some of the ETFs listed in the above table. Furthermore, they do not represent a specific investment recommendation for you, they merely show which ETFs from the universe I track are falling within the specified guidelines.
Contact Ulli