
- Moving the markets
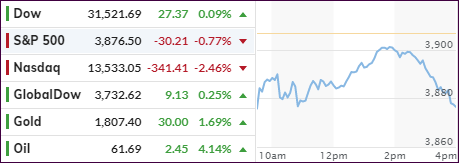
Despite a bullish theme in last night’s futures session, the regular one saw the bears take over, and the major indexes opened to the downside, just as we’ve seen recently. The remainder of the trading day was spent climbing out of that early hole with only the Dow managing to get back to even.
The S&P 500 and Nasdaq failed with the latter getting hit hard and closing at the lows of the day, which does not bode well for tomorrow’s opening.
Added CNBC:
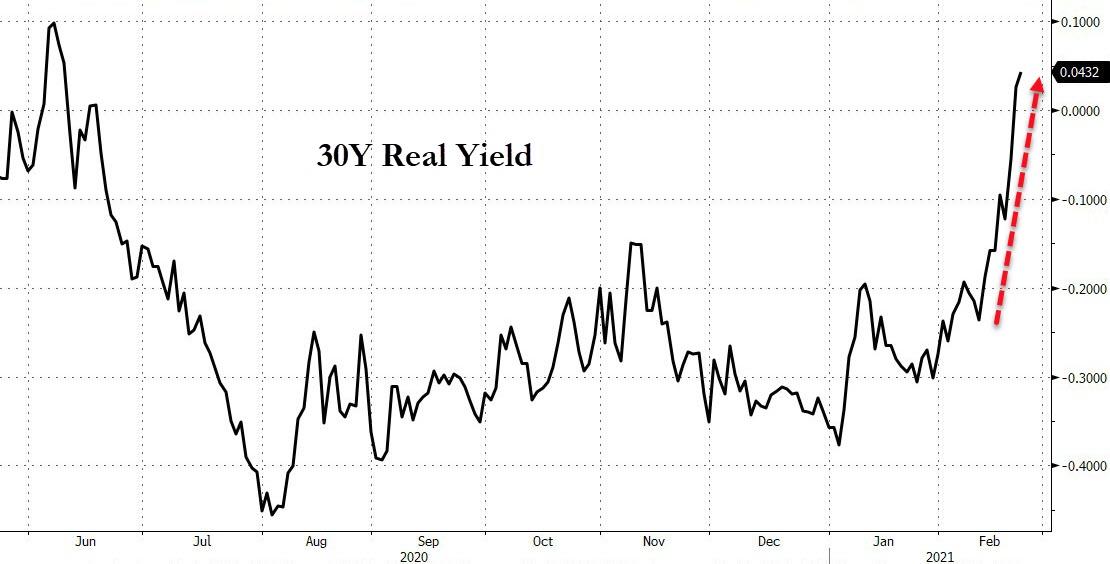
The 10-year Treasury yield rose again on Monday to around 1.36% after jumping 14 basis points last week to its highest level since February 2020. So far this month, the benchmark rate has moved up 27 basis points. The 30-year yield touched a one-year high of 2.2% Monday.
As I pointed out several times, the direction of bond yields will either support or punish equities. Right now, the trend is higher, which reduces traders’ appetite for stocks, especially in the tech sector, as big names got pressured today.
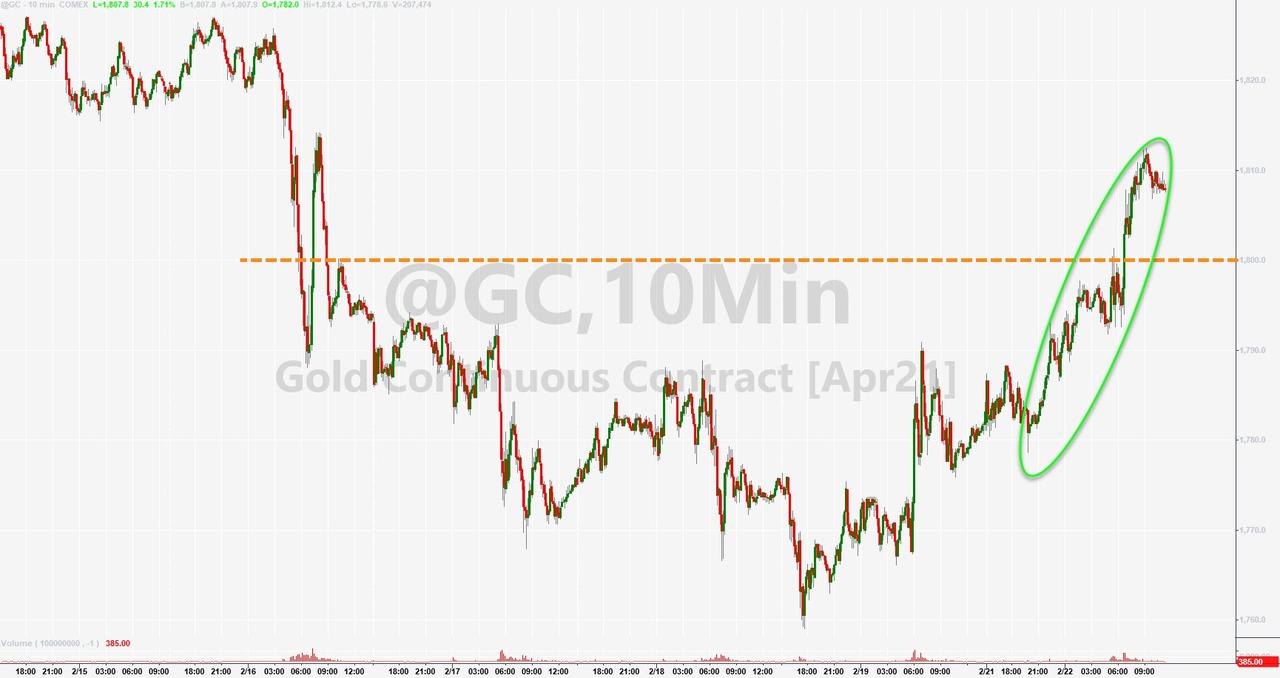
The reason is that fast high-growth tech companies, which rely on easy borrowing terms, could get hurt, and that is what we saw today. The good news was that Gold had a strong showing with +1.69%, which offset some of the tech losses.
On the other hand, some traders believe that the jump in bond yields simply reflects growing confidence in the nascent economic recovery by arguing that stocks should be able to absorb higher rates due to increased earnings.
Despite this current weakness, the markets have produced solid gains for the month, with the Dow and S&P having added around 5% and the Nasdaq +4.5%. SmallCaps have maintained their leadership with a solid +9.6%.
Let’s see if these numbers can hold up during the final 4 trading days.
2. ETFs in the Spotlight
In case you missed the announcement and description of this section, you can read it here again.
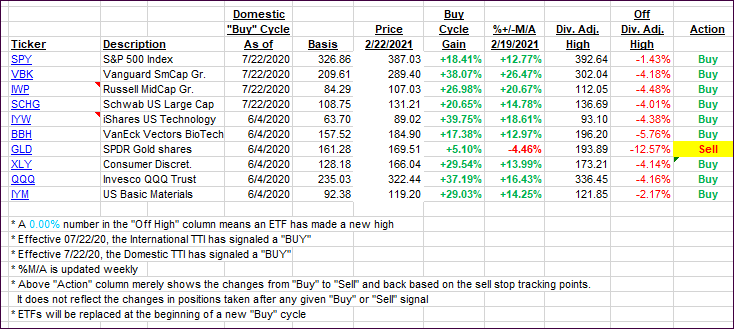
It features some of the 10 broadly diversified domestic and sector ETFs from my HighVolume list as posted every Saturday. Furthermore, they are screened for the lowest MaxDD% number meaning they have been showing better resistance to temporary sell offs than all others over the past year.
The below table simply demonstrates the magnitude with which these ETFs are fluctuating above or below their respective individual trend lines (%+/-M/A). A break below, represented by a negative number, shows weakness, while a break above, represented by a positive percentage, shows strength.
For hundreds of ETF choices, be sure to reference Thursday’s StatSheet.
For this current domestic “Buy” cycle, here’s how some our candidates have fared:
Click image to enlarge.
Again, the %+/-M/A column above shows the position of the various ETFs in relation to their respective long-term trend lines, while the trailing sell stops are being tracked in the “Off High” column. The “Action” column will signal a “Sell” once the -8% point has been taken out in the “Off High” column. For more volatile sector ETFs, the trigger point is -10%.
3. Trend Tracking Indexes (TTIs)
Our TTIs gained a tad despite the major indexes showing weakness.
This is how we closed 2/22/2021:
Domestic TTI: +18.01% above its M/A (prior close +17.81%)—Buy signal effective 07/22/2020.
International TTI: +17.71% above its M/A (prior close +17.41%)—Buy signal effective 07/22/2020.
Disclosure: I am obliged to inform you that I, as well as my advisory clients, own some of the ETFs listed in the above table. Furthermore, they do not represent a specific investment recommendation for you, they merely show which ETFs from the universe I track are falling within the specified guidelines.
Contact Ulli