
- Moving the markets
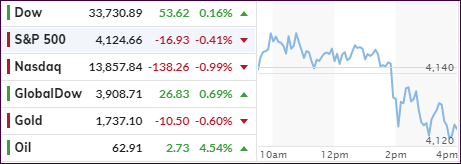
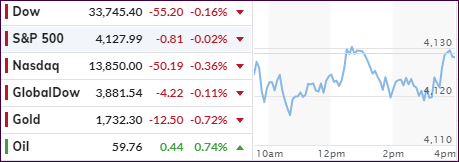
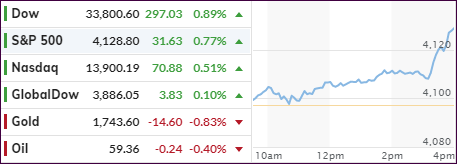
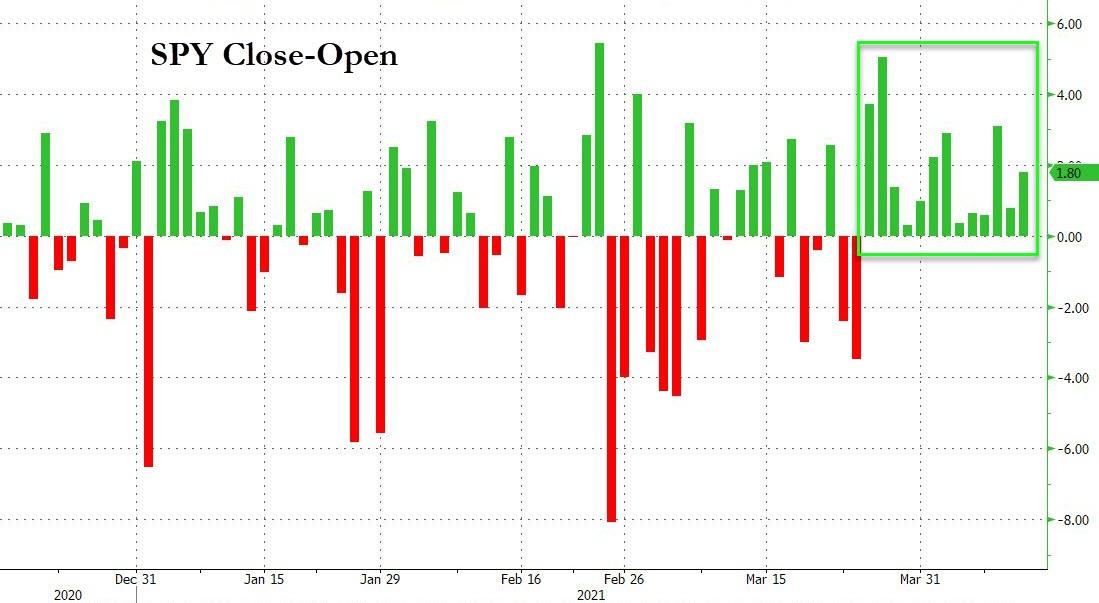
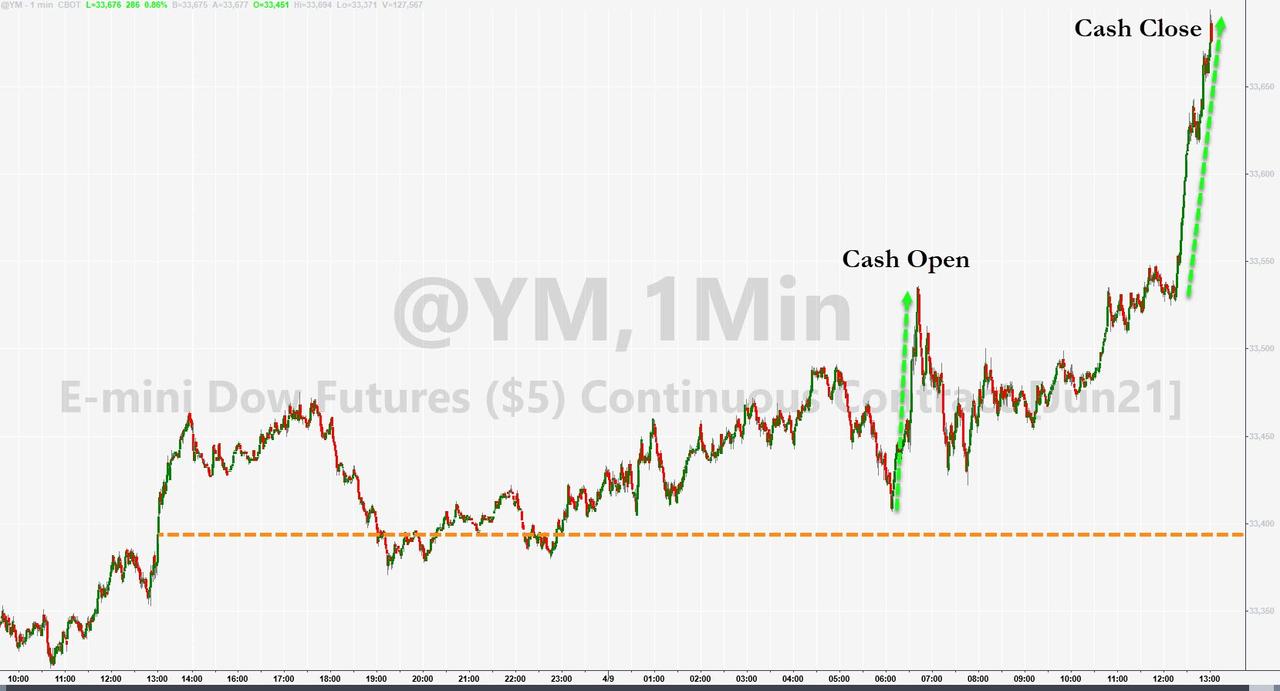
After an early pump, the major indexes lost momentum with the S&P 500 and Nasdaq ending up in the red, while the Dow managed to stay above its unchanged line.
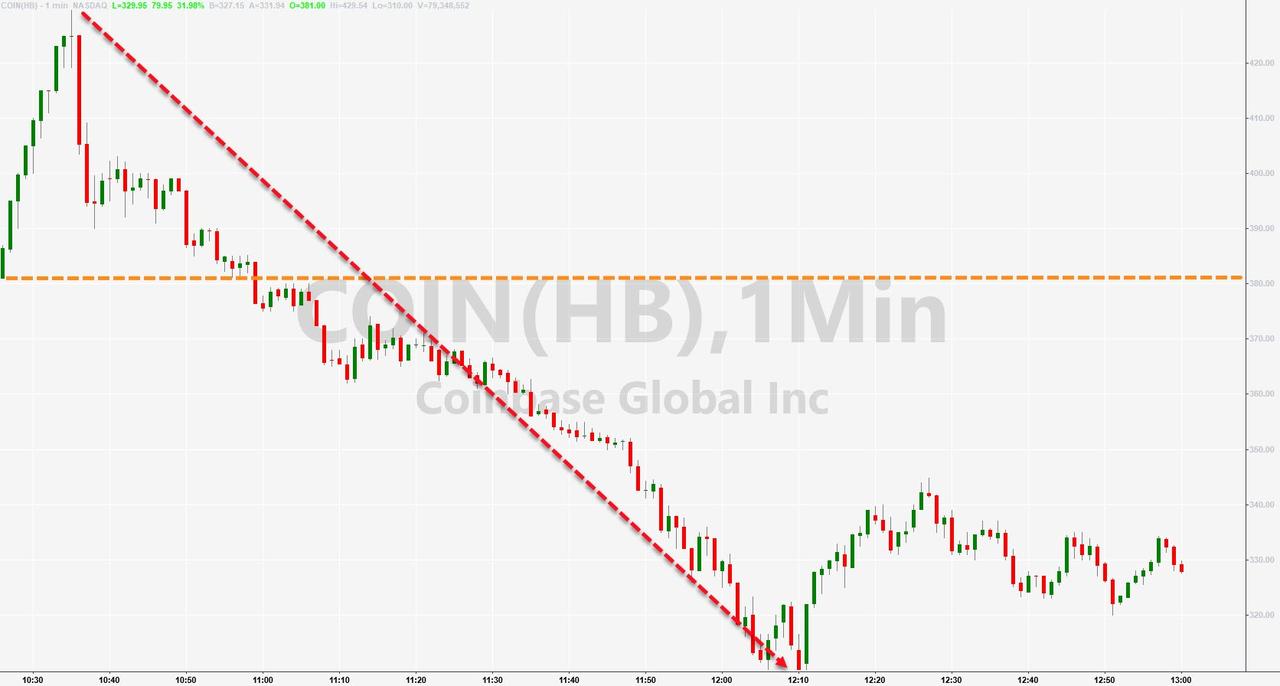
Strong bank earnings helped the financial sector with XLF gaining +0.63%, but that was offset by tech stocks tanking, despite the widely anticipated IPO of Coinbase. The stock rallied at first but then most momentum and closed below its IPO price.
Added the chief strategist of TD Ameritrade:
The first wave of Q1 big bank results look pretty much as strong as most analysts had expected – even stronger actually, it’s possible that we’re in a powerful market that’s in a forgiving mood when it comes to bad news. The path of least resistance for stocks continues to seem to be to go higher, with the market climbing a wall of worries that just doesn’t go away.
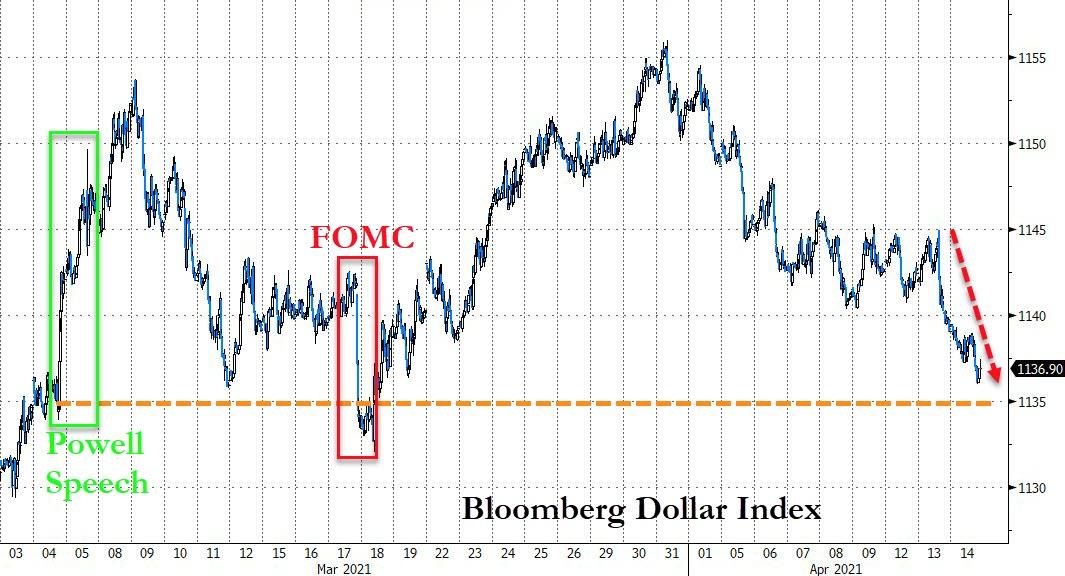
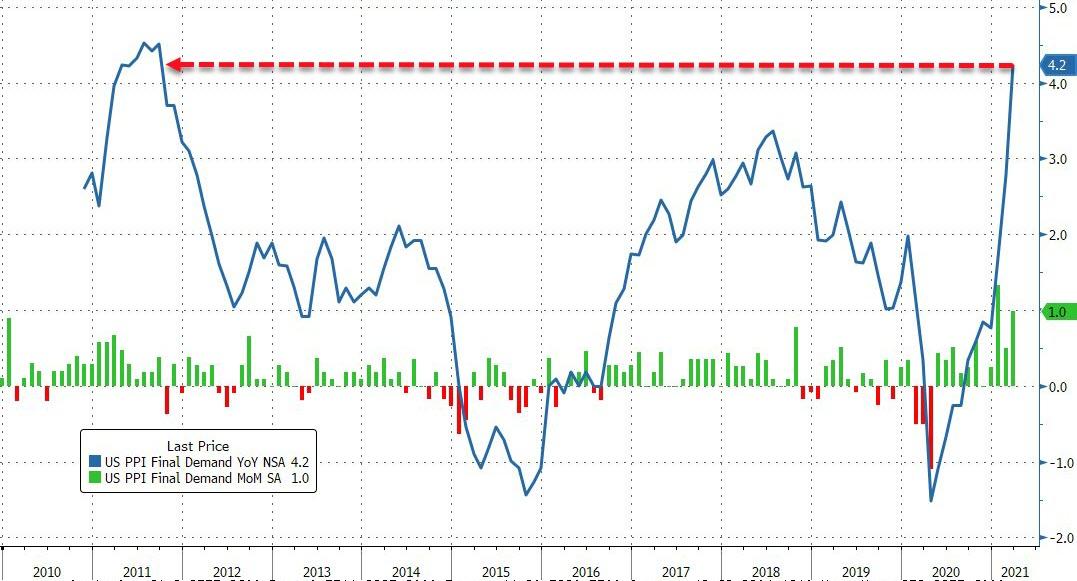
On the economic front, we learned that soaring import and export price inflation has finally been noted with the Commodity ETF DBC rocketing +2.30%. None of this was addressed by Fed head Powell speaking before the Economic Club of Washington.
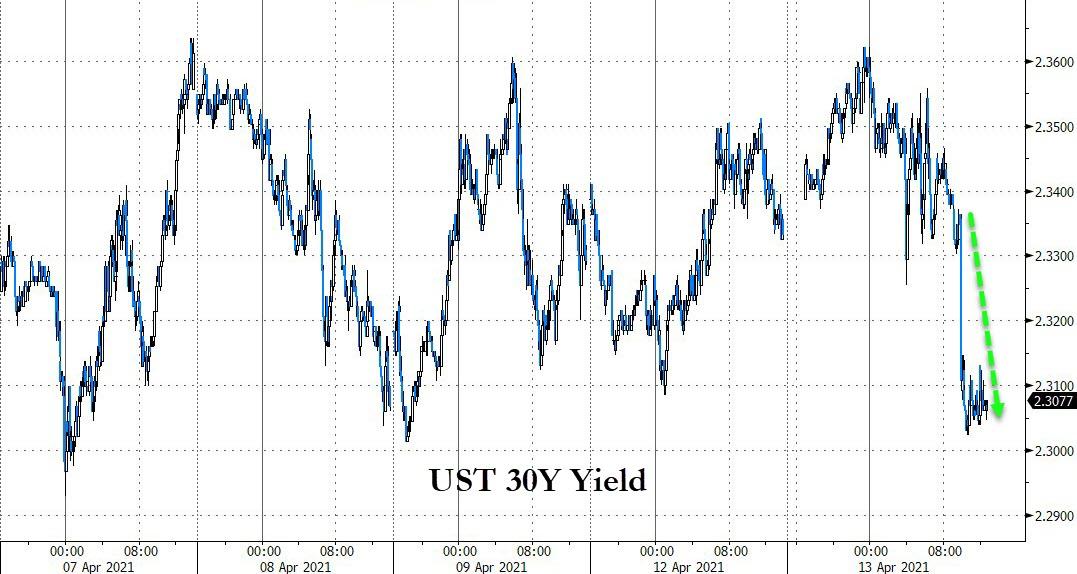
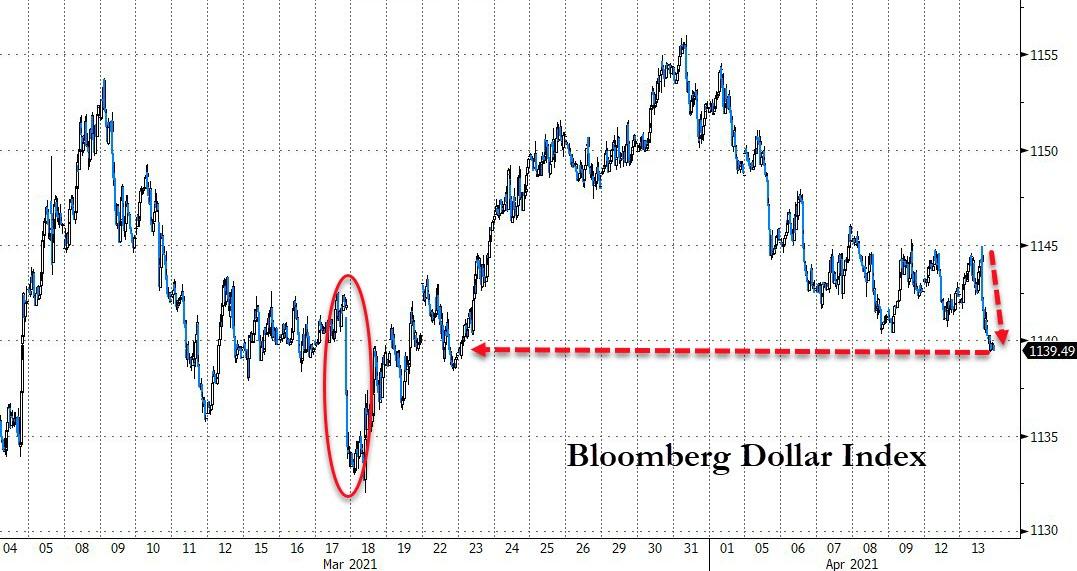
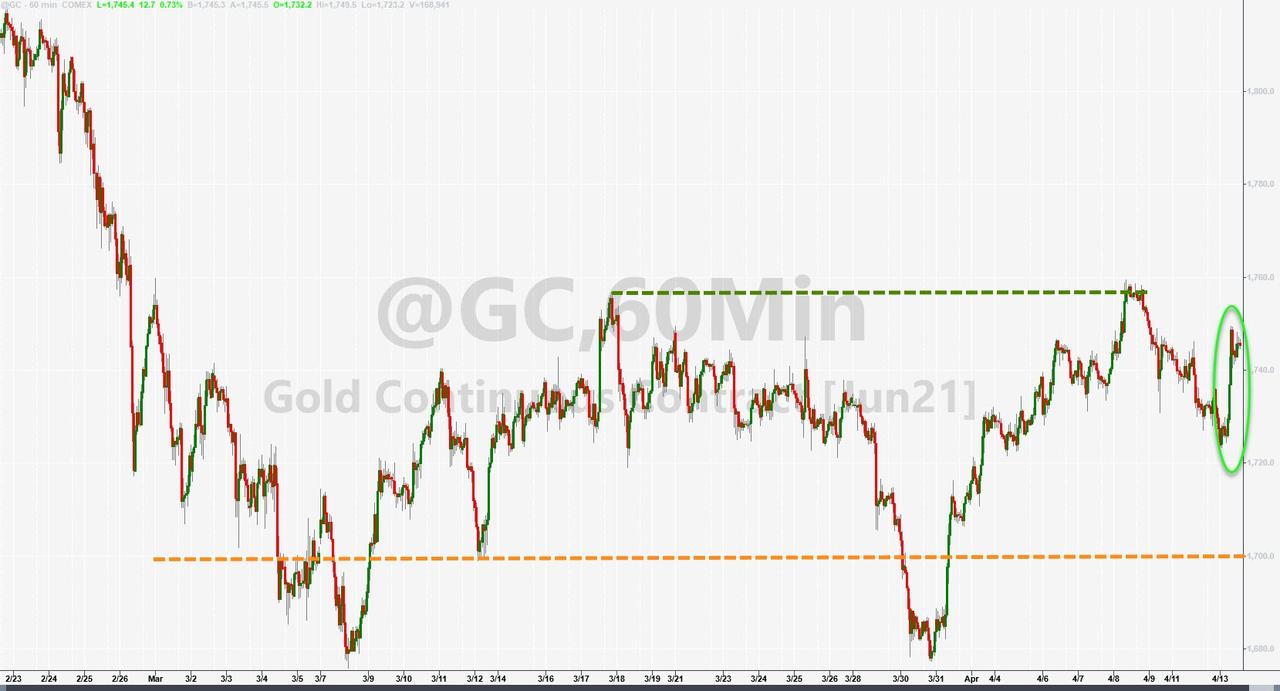
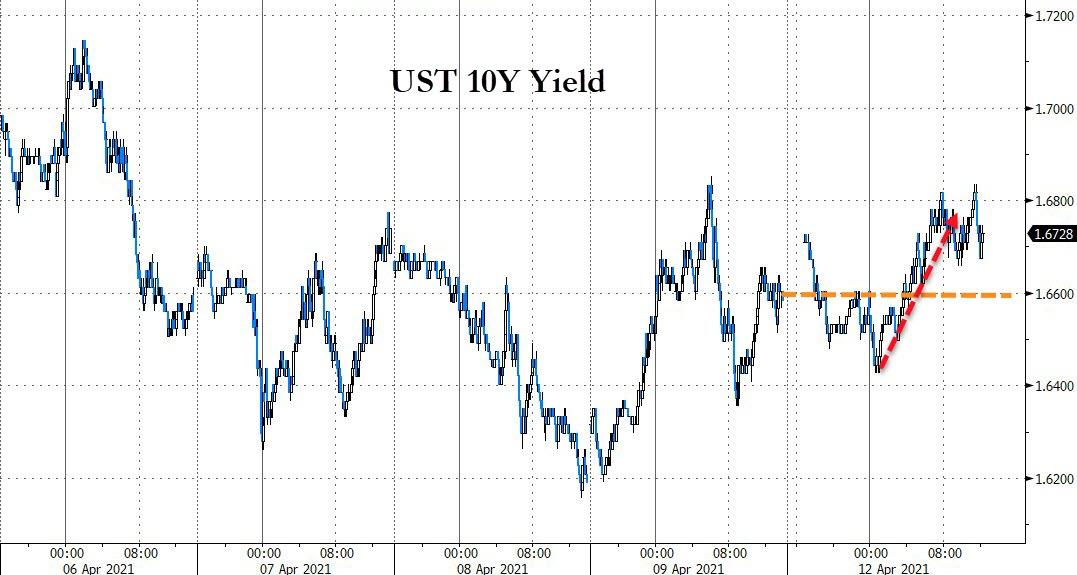
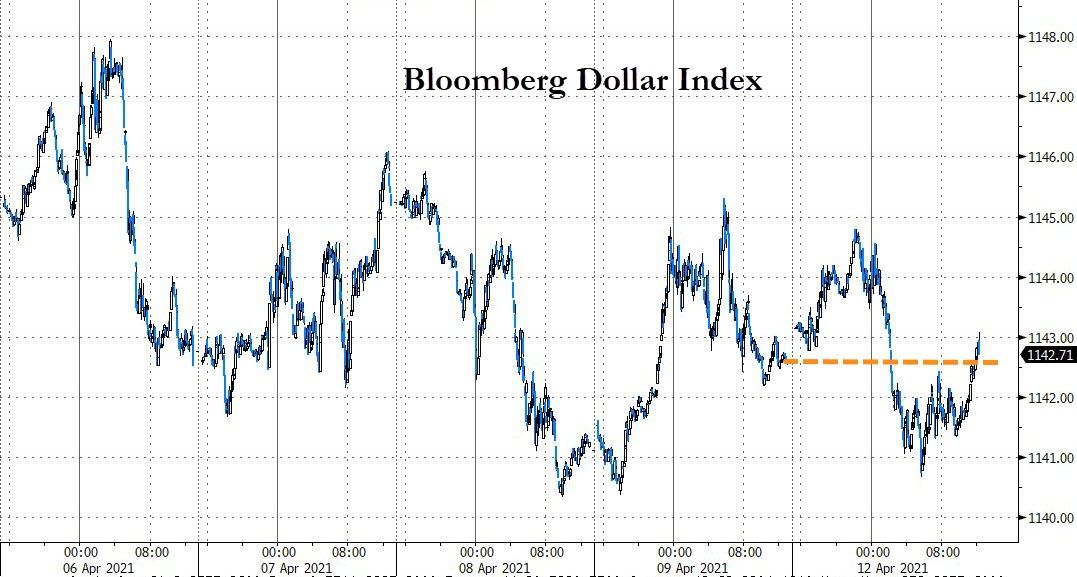
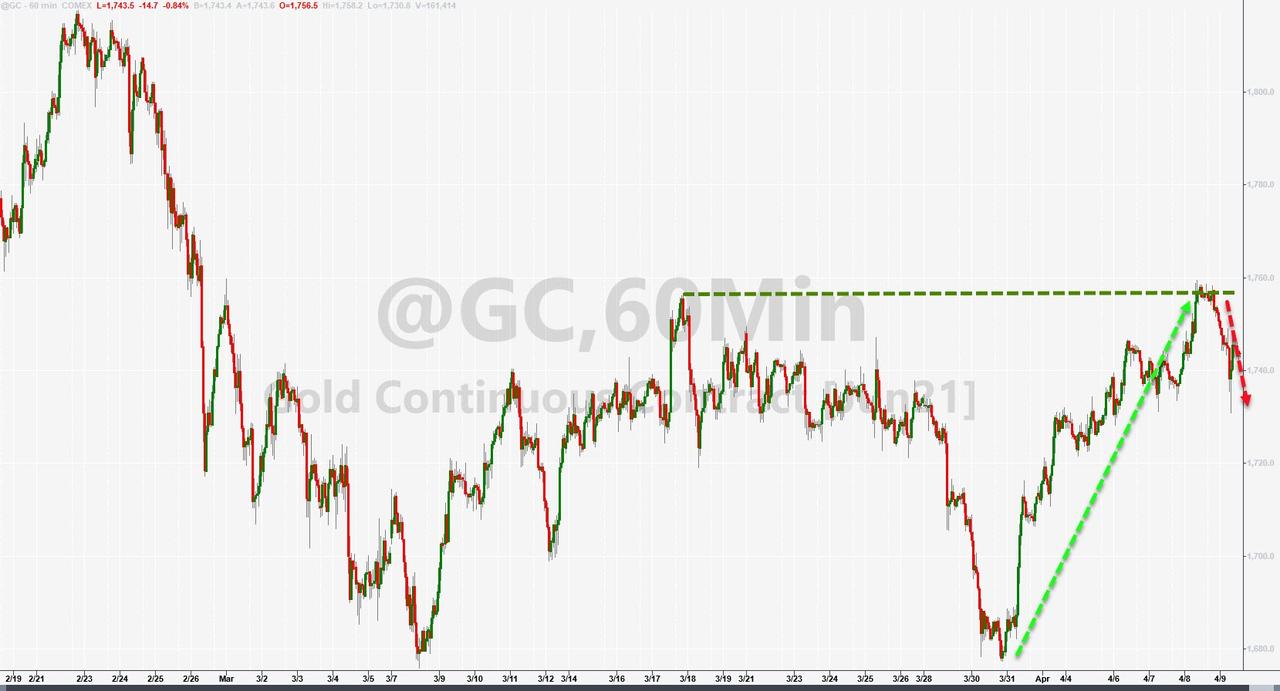
The US Dollar took a dive and approached a key support level, bond yields inched up a bit, and Gold gave back some of yesterday’s gains.
Another session where not much was gained or lost.
Read More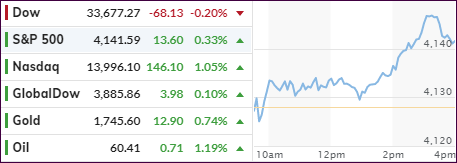
