Slumping Two Days In A Row

Ulli Market Commentary Contact

[Chart courtesy of MarketWatch.com]

  1. Moving the markets

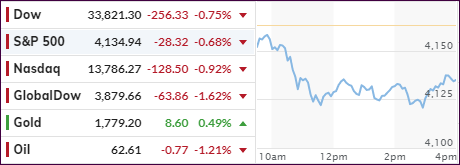
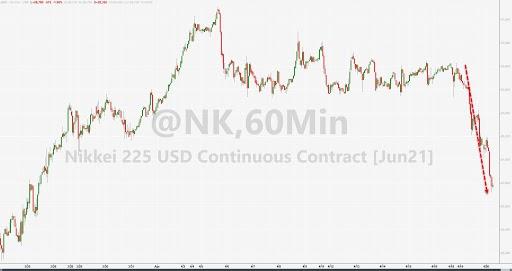
Overnight, the Japanese markets painted a gloomy picture, as Tokyo pushed for a third COVID state of emergency with new cases spiking. Full-fledged lockdowns are being considered with the IOC possibly canceling this summer’s Olympics.

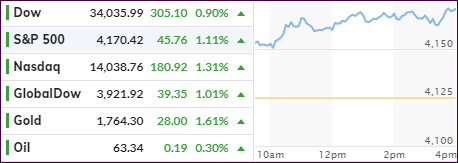
That gloomy mood carried over into the US markets, with major indexes opening to the downside but never managing to stage any kind of recovery. A last hour bounce reduced losses somewhat, but the overall tone remained bearish.

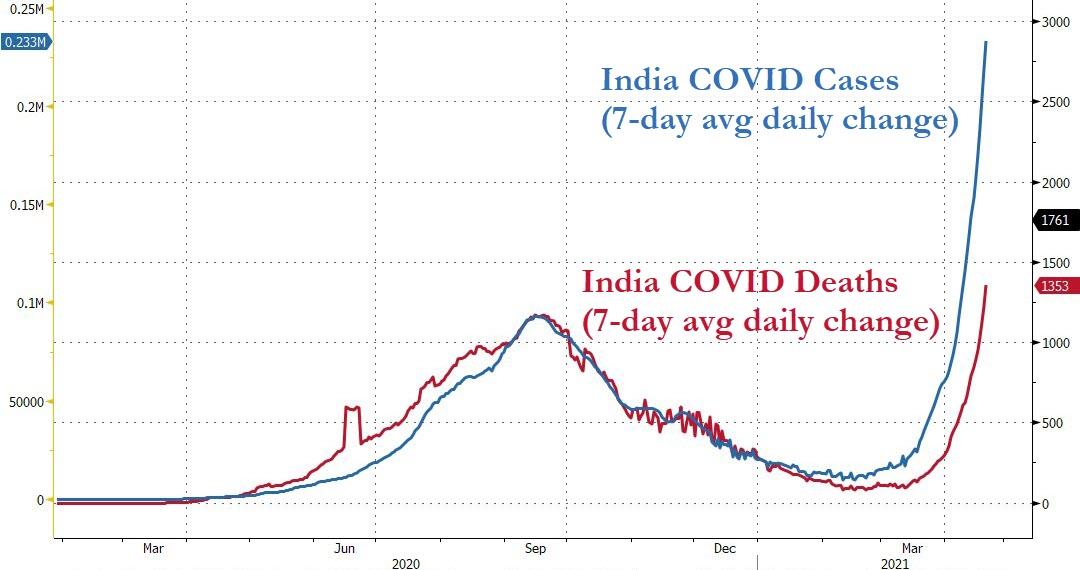
Even strong corporate earnings did not provide enough ammo to improve market sentiment. On a global basis, Covid cases in India followed Japan’s example, thereby questioning the much hoped for positive reopening scenario.

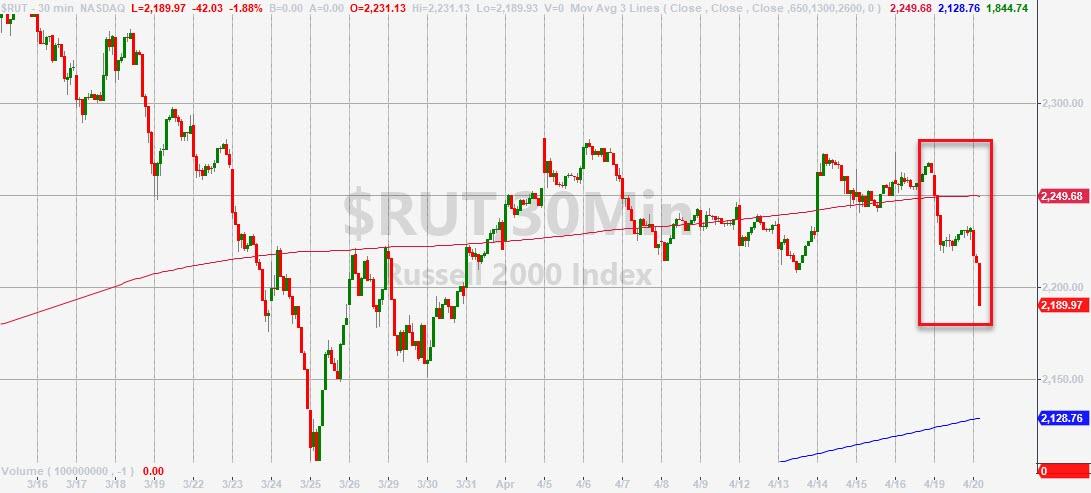
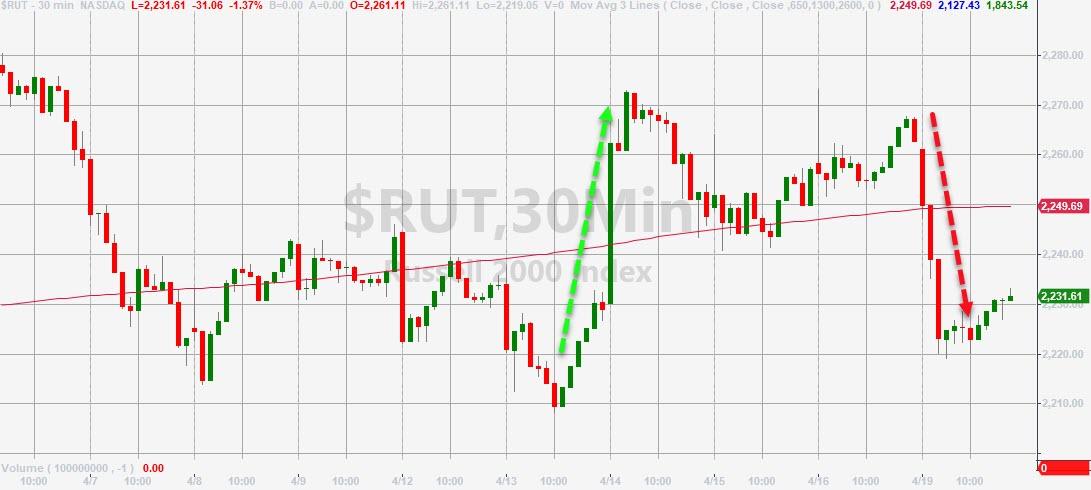
Airlines led the surge to lower prices, after UA reported its fifth consecutive quarterly loss. SmallCaps, which started the year with a bang, puked today with the Russell 2000 dropping below its 50-day M/A with not much support down to its 100-day M/A, according to ZH.

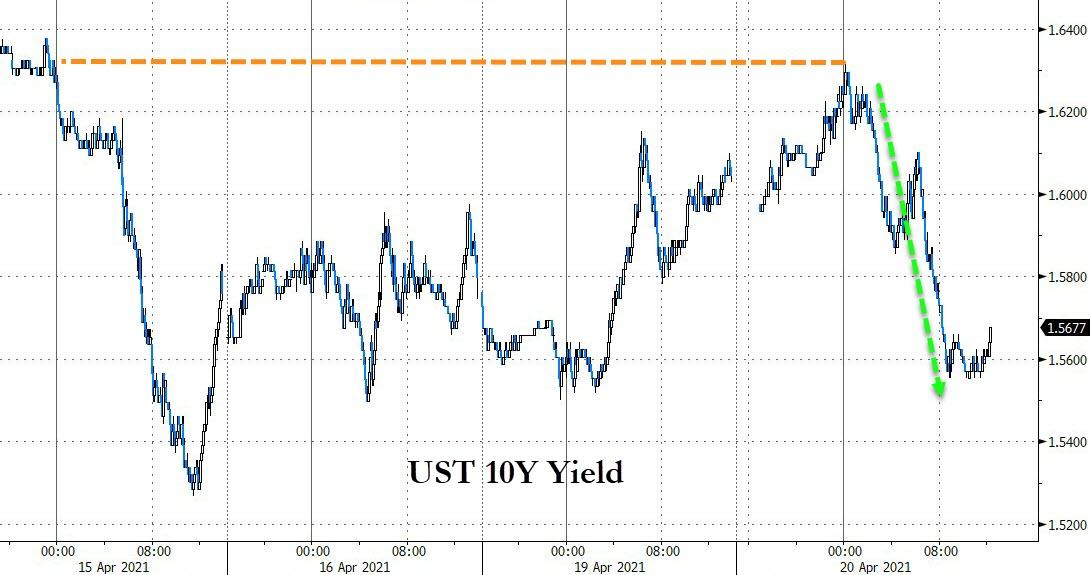
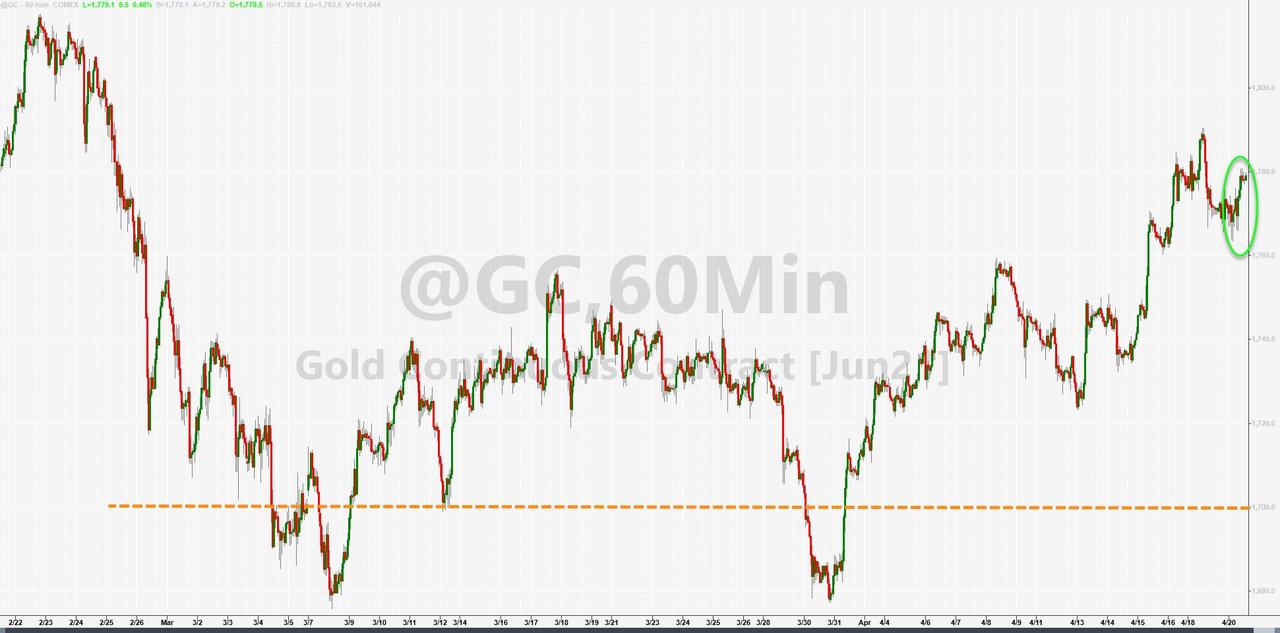
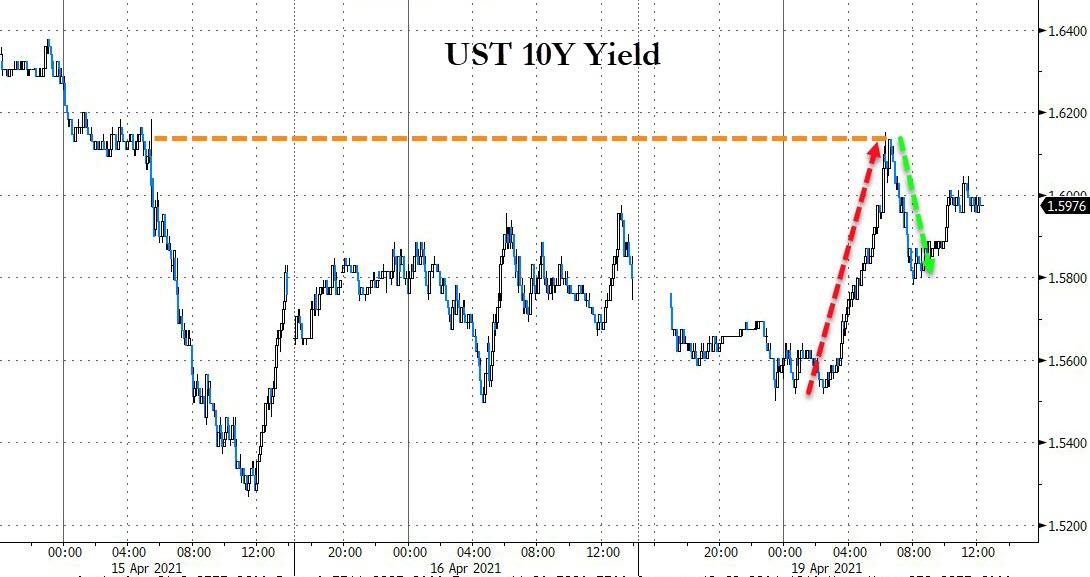
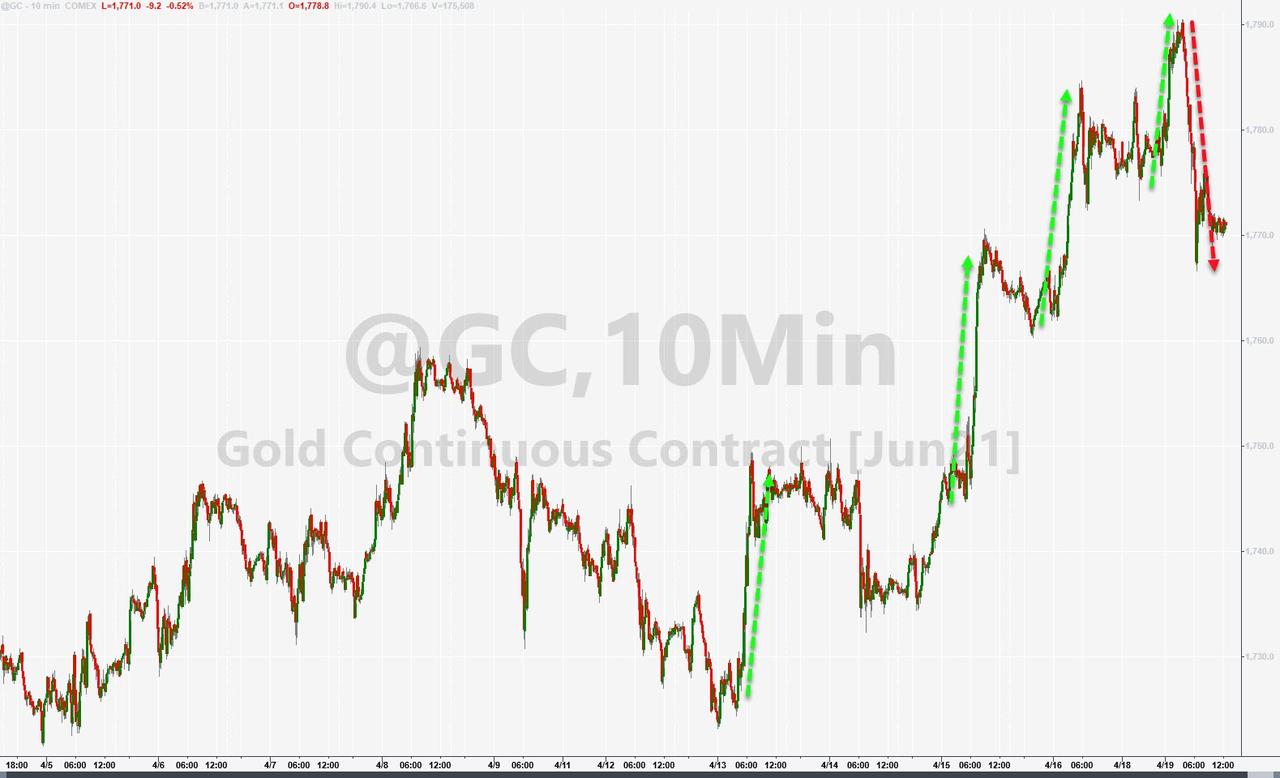
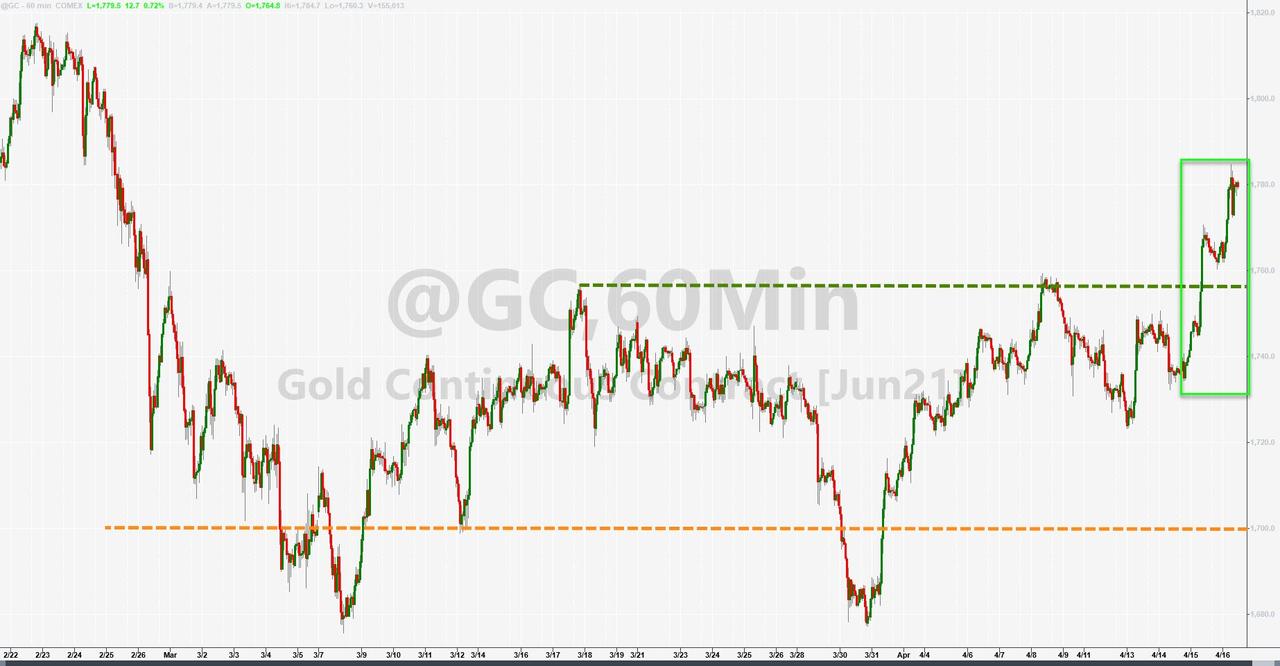
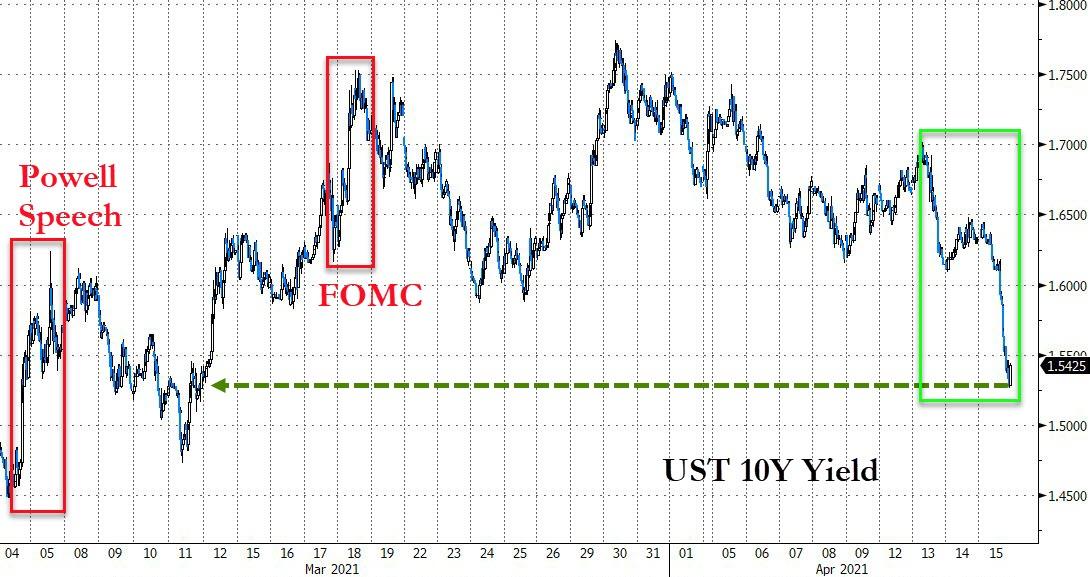
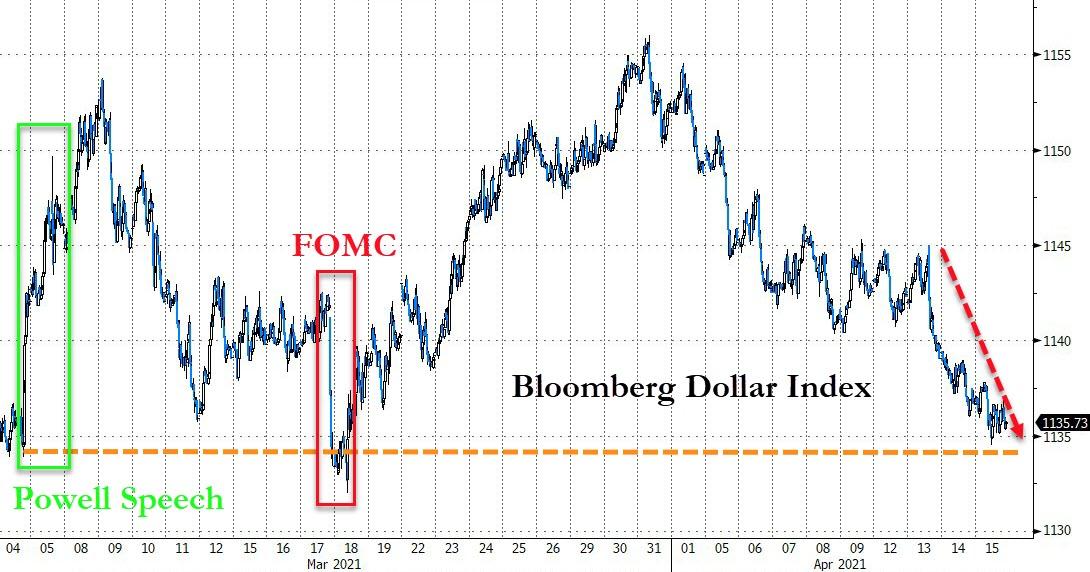
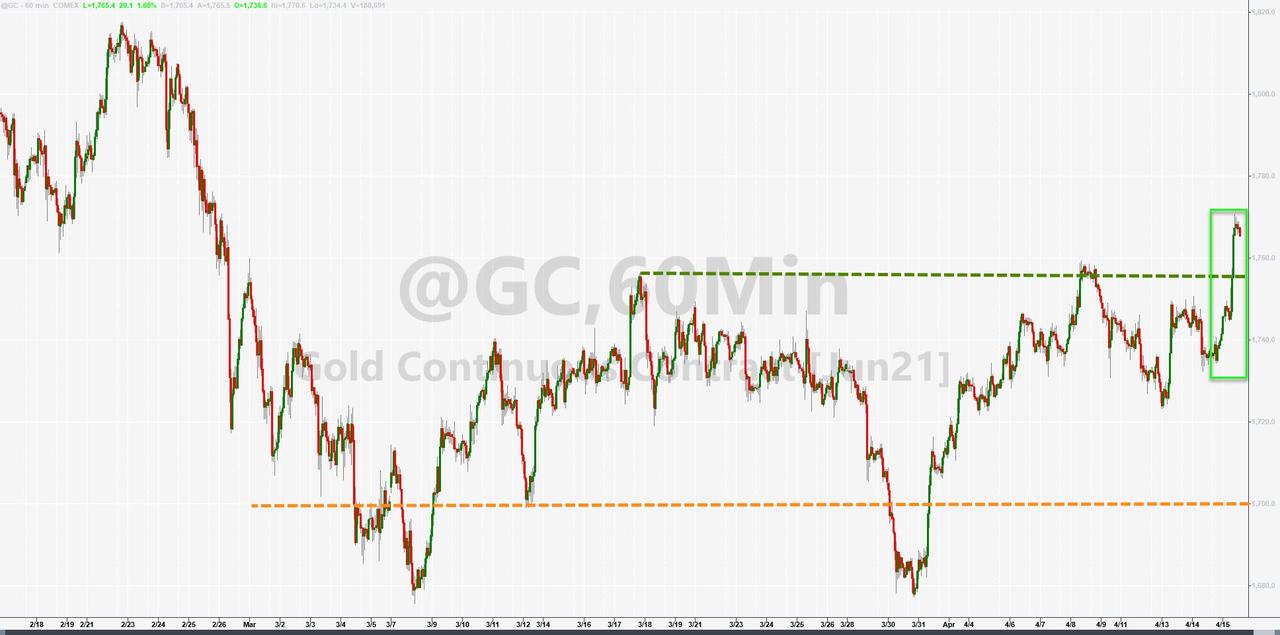
With so much uncertainty, bond prices benefited as yields slid below 1.6%, allowing Gold to add a modest 0.46%, which was one of the few green numbers we saw today. The US Dollar also rebounded from a recent steep sell off and did not affect gold negatively, which is odd.

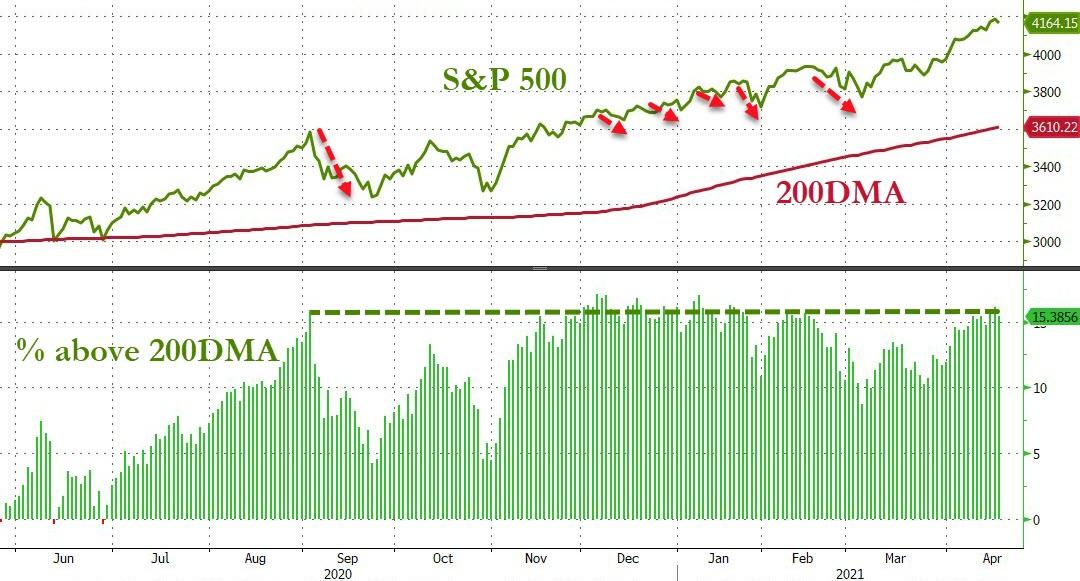
Right now, the markets look somewhat frothy and overbought, which why we are seeing this correction. After all, we just witnessed new ATHs for the Dow and S&P 500 last Friday.  

Read More

Stumbling Off The Highs

Ulli Market Commentary Contact

[Chart courtesy of MarketWatch.com]

  1. Moving the markets

The major indexes started the week in the red and stayed there throughout the session, as it appeared that traders had lost their appetite and any buying motivation. Weakness in the tech sector did not help and, given the fact that the Dow and S&P 500 just scored new highs on Friday, it comes as no surprise that a pause was in order.

Banks were lower due to profit taking after last week’s positive earnings fest with the financial sector, as represented by XLF, giving back a modest 0.28%. Overall, the pullback was fairly small, yet broad, as there were no winners, other than the commodity index (DBC), which managed a green close by adding +0.23%.

We saw no economic data releases and therefore no motivator of any kind to get the bullish juices flowing. ZH concluded that “it seems that investors just didn’t like Monday.”   

SmallCaps were the worst performers and just broke below their 50-day M/A, as ZH pointed out. Bond yields dropped, and the US Dollar continued its slide, but neither event could save gold from slipping off its overnight highs.   

Noted ZH: The S&P 500 is now 15% above its 200-day M/A, a level that in the past has marked a turning point.

Will history rhyme again?

Read More

ETFs On The Cutline – Updated Through 04/16/2021

Ulli ETFs on the Cutline Contact

Below, please find the latest High-Volume ETF Cutline report, which shows how far above or below their respective long-term trend lines (39-week SMA) my currently tracked ETFs are positioned.

This report covers the HV ETF Master List from Thursday’s StatSheet and includes 312 High Volume ETFs, defined as those with an average daily volume of more than $5 million, of which currently 253 (last week 245) are hovering in bullish territory. The yellow line separates those ETFs that are positioned above their trend line (%M/A) from those that have dropped below it.

Take a look:                                                                   

The HV ETF Master Cutline Report

In case you are not familiar with some of the terminology used in the reports, please read the Glossary of Terms. If you missed the original post about the Cutline approach, you can read it here.      

ETF Tracker Newsletter For April 16, 2021

Ulli ETF Tracker Contact

ETF Tracker StatSheet          

You can view the latest version here.

CLOSING A WINNING WEEK ON A POSITIVE NOTE

[Chart courtesy of MarketWatch.com]

  1. Moving the markets

New records were set again today, as the Dow and S&P 500 continued their ascent to ever new highs. Strong earnings from blue chip companies gave the assist, as well as data signaling that the economy has maintained its recovery.

We learned that the Consumer Sentiment Index rose to a one-year high, while Fed Gov Waller supported the bullish mood by remarking that despite the US economy taking off, there would be no reason to start tightening policy.

The last of the six largest banks, Morgan Stanley, posted stronger than expected results helping the financial ETF XLF to register a solid gain.

All three major indexes closed in the green, led by the Dow and S&P 500, with the Nasdaq being the weakling as the index barely crawled back above its unchanged line.

Bond yields bounced a tad today but remain under the 1.6% level for the 10-year. The US Dollar continued its slide, but Gold found some unexpected support, after China announced this (via ZH):

The People’s Bank of China (PBOC), the nation’s central bank, controls how much gold enters China through a system of quotas given to commercial banks. It usually allows enough metal in to satisfy local demand but sometimes restricts the flow.

In recent weeks it has given permission for large amounts of bullion to enter, the sources said.

“We had no quotas for a while. Now we are getting them … the most since 2019,” said a source at one of the banks moving gold into China.

Around 150 tons of gold worth $8.5 billion at current prices is likely to be shipped, four sources said. Two of the sources said the bullion would be shipped in April. Two others said it would reach China over April and May.

If that trend continues, we might see gold’s upward momentum finally reestablish itself, supported also by inflationary pressures, the likes of which we are all aware of, but which has been ignored by the Fed.

Be that as it may, for the time being, traders and analysts are viewing the current market environment as a “goldilocks” scenario and further advances are likely.  

Read More

Weekly StatSheet For The ETF Tracker Newsletter – Updated Through 04/15/2021

Ulli ETF StatSheet Contact

ETF Data updated through Thursday, April 15, 2021

Methodology/Use of this StatSheet:

1. From the universe of over 1,800 ETFs, I have selected only those with a trading volume of over $5 million per day (HV ETFs), so that liquidity and a small bid/ask spread are assured.

2. Trend Tracking Indexes (TTIs)

Buy or Sell decisions for Domestic and International ETFs (section 1 and 2), are made based on the respective TTI and its position either above or below its long-term M/A (Moving Average). A crossing of the trend line from below accompanied by some staying power above constitutes a “Buy” signal. Conversely, a clear break below the line constitutes a “Sell” signal. Additionally, I use an 8% trailing stop loss on all positions in these categories to control downside risk.

3. All other investment arenas do not have a TTI and should be traded based on the position of the individual ETF relative to its own respective trend line (%M/A). That’s why those signals are referred to as a “Selective Buy.” In other words, if an ETF crosses its own trendline to the upside, a “Buy” signal is generated. Since these areas tend to be more volatile, I recommend a wider trailing sell stop of 8%-10% depending on your risk tolerance.

If you are unfamiliar with some of the terminology, please see Glossary of Terms and new subscriber information in section 9.     

1. DOMESTIC EQUITY ETFs: BUY — since 07/22/2020

Click on chart to enlarge

Our main directional indicator, the Domestic Trend Tracking Index (TTI-green line in the above chart) has now rallied above its long-term trend line (red) by +20.51% and remains in “BUY” mode as posted.

Read More

Dow And S&P 500 Score New Records

Ulli Market Commentary Contact

[Chart courtesy of MarketWatch.com]

  1. Moving the markets

The unchanged line was nowhere near in sight, as the major indexes roared higher after the opening bell and never looked back with the Dow and S&P 500 reaching new all-time highs. Big tech surged and maintained their dominance over SmallCaps, while “growth” outperformed “value.”

Strong earnings and some economic reports painted a rosy picture for consumer spending and the jobs market. Bond yields dropped with the 10-year sliding to 1.56%, although the US Dollar index trod water.

Not just were stocks the beneficiary of the bullish theme, because of lower yields, Gold had its day in the sun and finally rocketed higher by 1.68%, while nearing two-month highs and outperforming even the Nasdaq

Much ado was made about the headline announcing that initial jobless claims dropped back below 600k for the first time since early March 2020. But, as ZH pointed out, this may have been an aberration:

Notably, the drop in claims was largely driven by a 75,645 drop in California… which, as Joe Brusuelas suggests, is indicative of the problems that remain in processing claims, backlogs, and fraud in the states.

Ah yes, the devil is always in the details…

Black Rock’s CEO Larry Fink described the current scenario like this:

I am incredibly bullish on the markets, and you are right to be worried about our deficits. If we don’t have economic growth that is sustainable over the next 10 years — our deficits are going to matter, and they are going to elevate interest rates … I believe because of monetary stimulus, fiscal stimulus, cash on the sidelines, earnings, markets are okay. Markets are going to continue to be stronger.

Optimism despite deficits and consumer inflation, but for right now traders’ minds are noticing nothing but bullish momentum.

Read More