
- Moving the markets
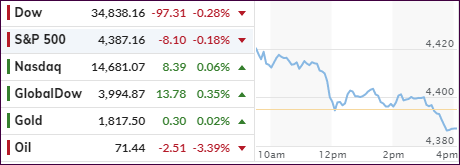
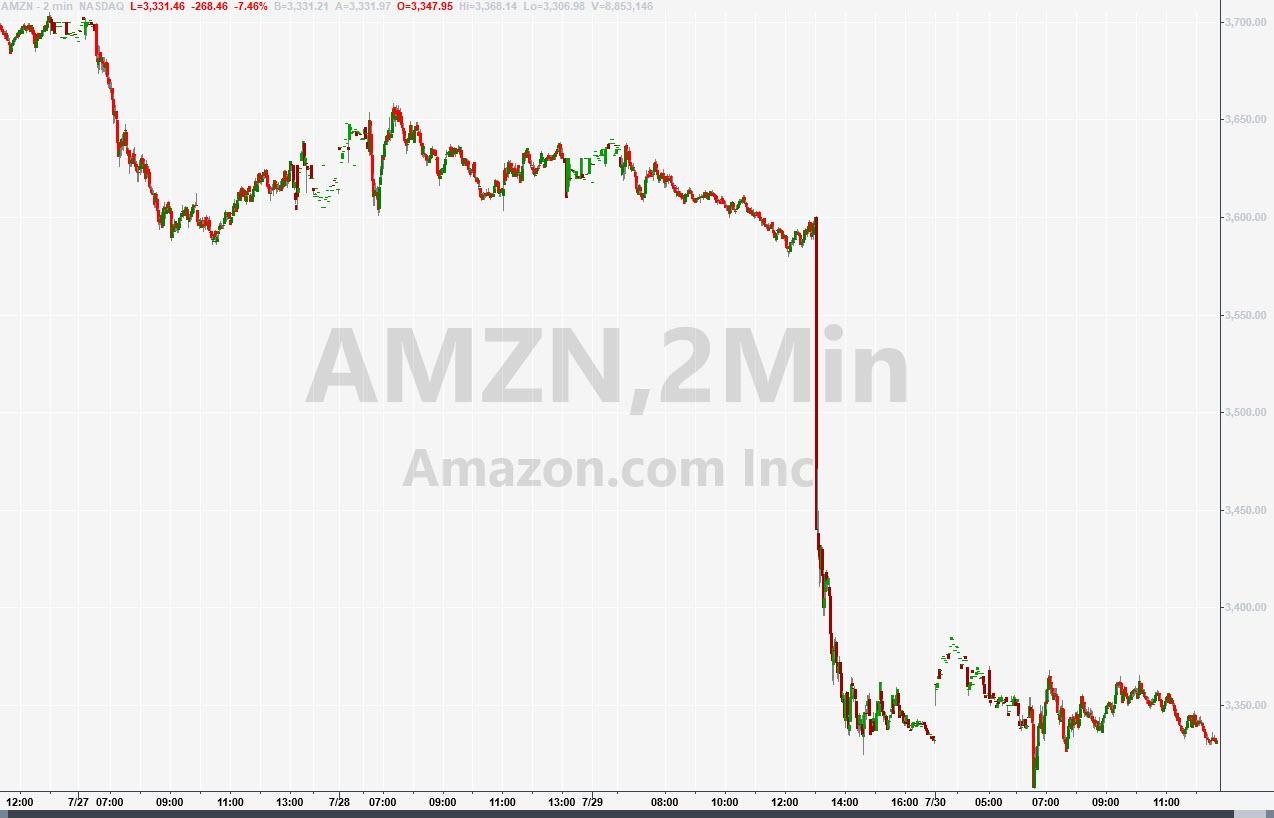
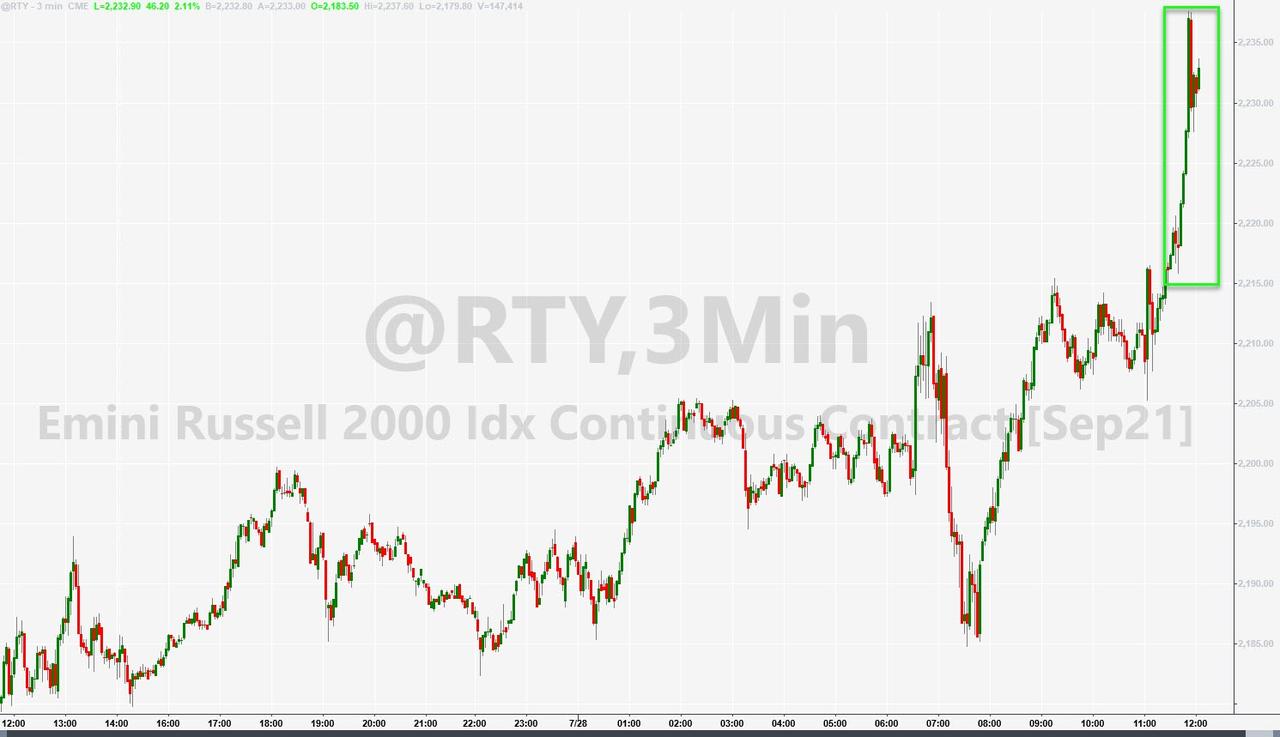
An early rally hit the skids with the major indexes giving back all their substantial initial gains. The exception was the Nasdaq, which managed to end up fractionally above its unchanged line.
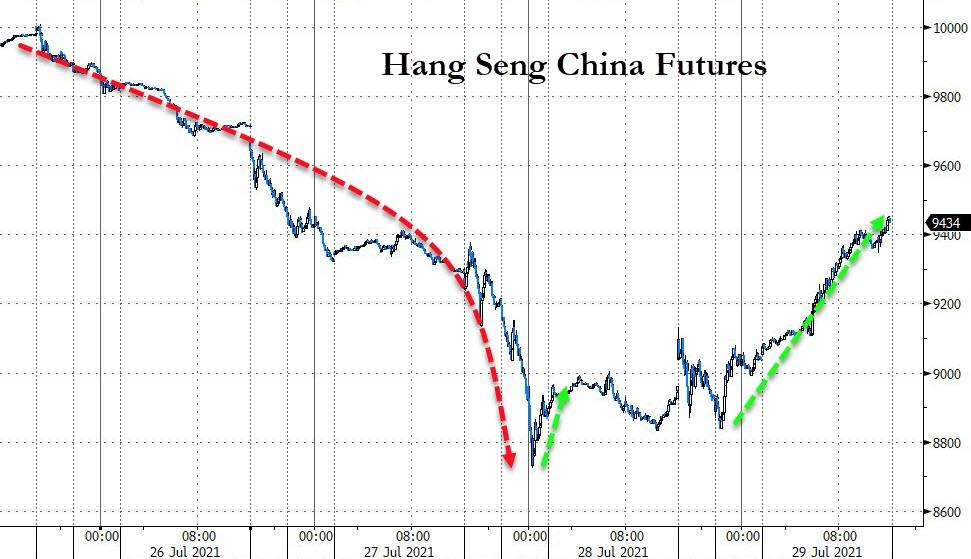
Contributing to this sudden transformation in sentiment were the same old standbys, as Covid variants and slowing economic growth overwhelmed strong earnings reports.
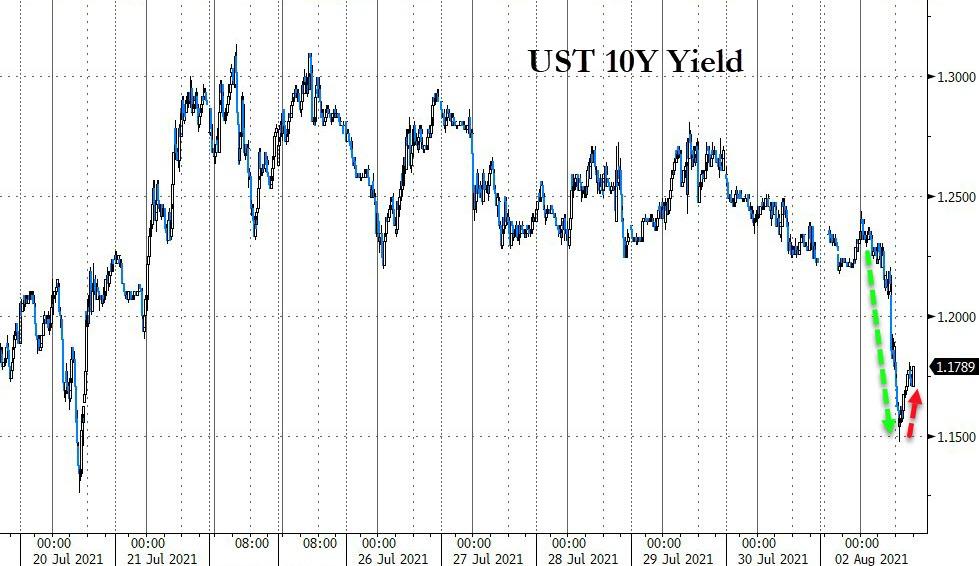
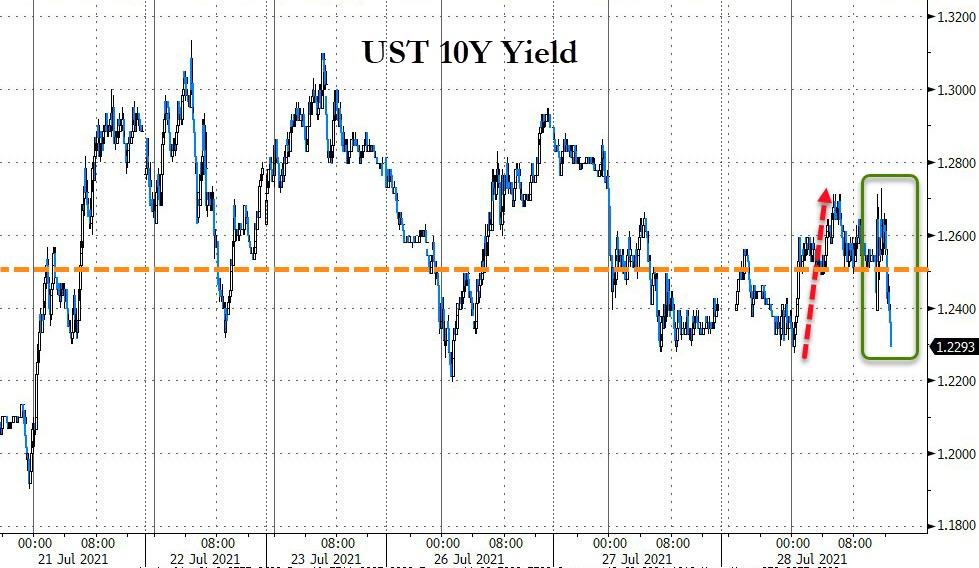
The dead giveaway, that the economy is not all it can be, became obvious as bond yields tumbled just as they did last week when the same issues surfaced. The 10-year crashed to the 1.15% level before rebounding into the close.
The cause of this sudden change of heart, was the Manufacturing ISM survey, the index of which fell to its lowest in 2021, with the “soft” data now starting to catch “down” to hard data’s reality, as ZeroHedge put it.
That created havoc in the bond and stock markets, the latter of which were spooked some more after the Fed’s Waller warned in the last hour that good jobs data reports could move the timetable for the Fed by possibly “tapering early and fast.” To traders that means the punchbowl of easy money could be endangered, so stocks dumped off their early highs.
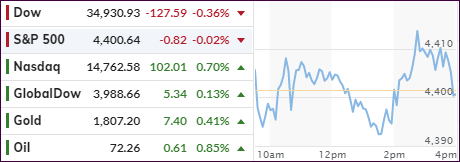
In the end, it was only this morning’s unrealized gains that were given back, as the major indexes barely crossed their unchanged lines into the red. Whether this is a harbinger of things to come remains to be seen.
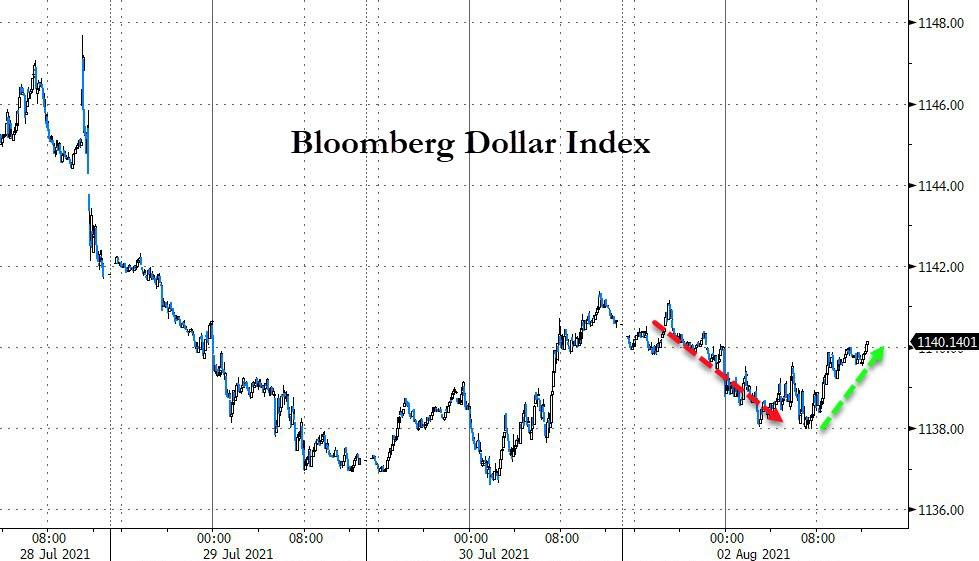
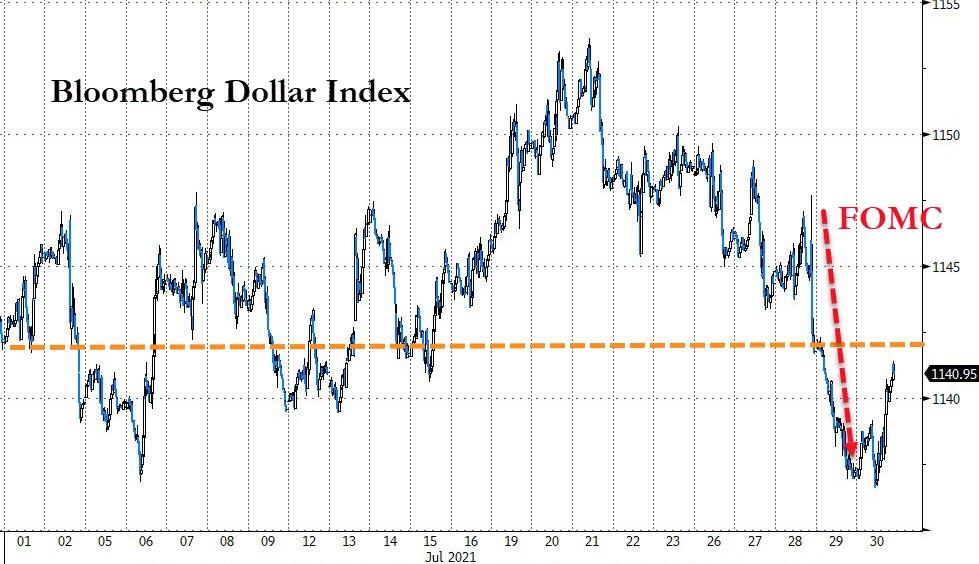
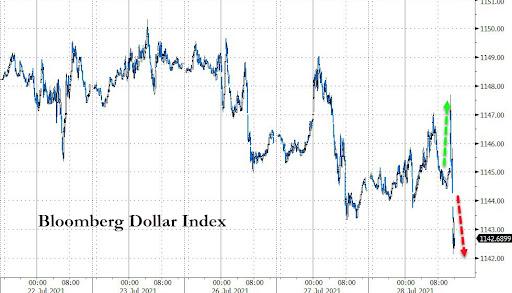
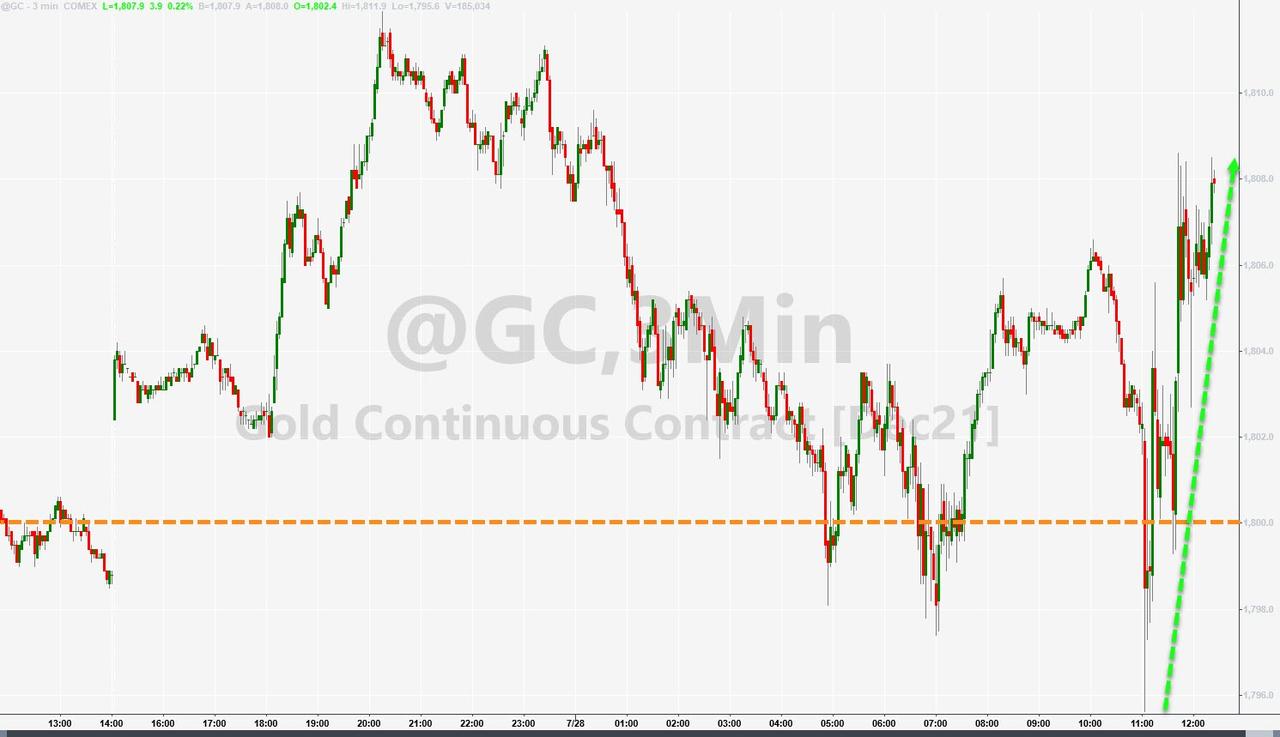
The US Dollar index went the other way by selling off early on but rallying back into the close. Despite this chaotic back and forth, gold managed to come back from an early pullback and ended unchanged.
To make it easier for you to follow my various blog posts, you can view the current schedule here.
Read More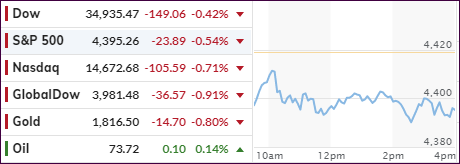
