
- Moving the markets
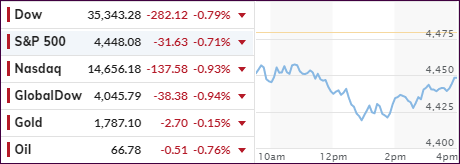
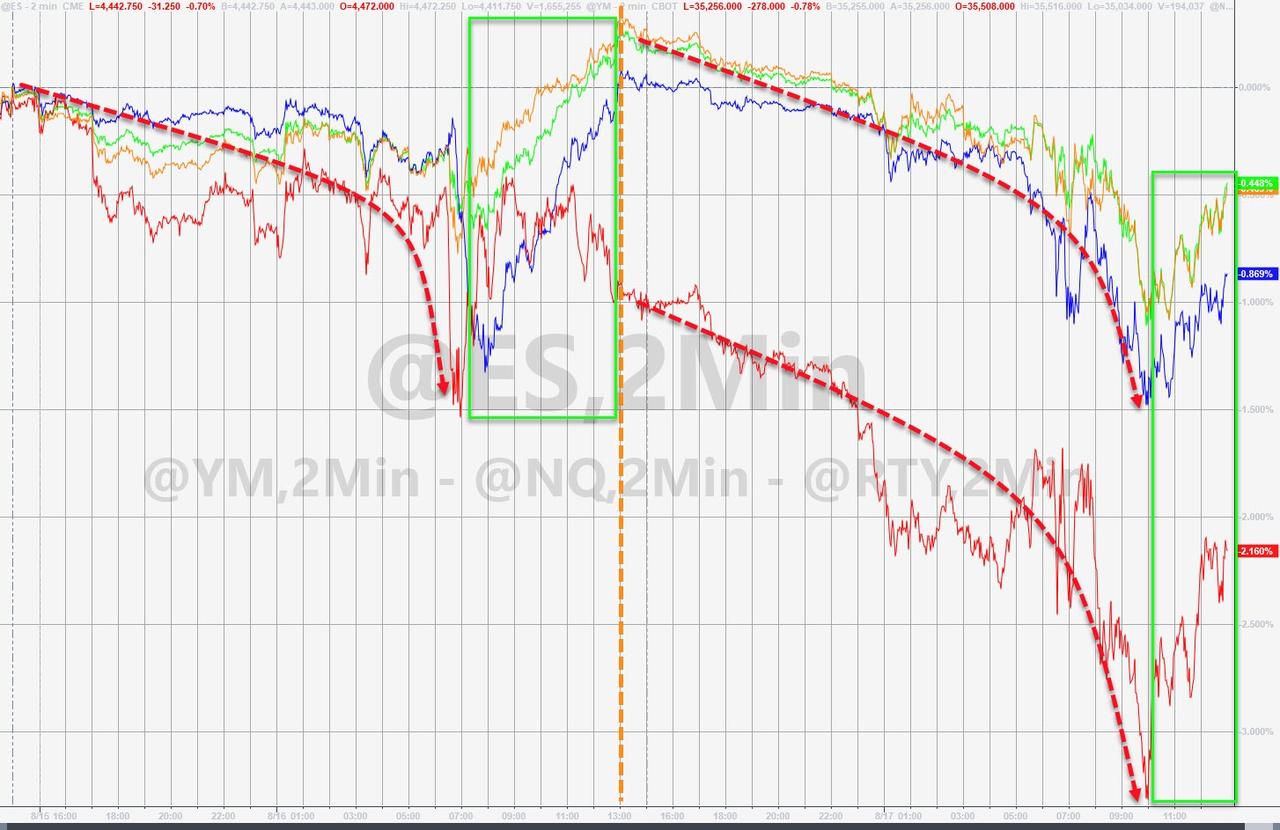
An early dump in the markets was not followed by the usual afternoon pump, as a meager rebound attempt failed to make up for the early losses.
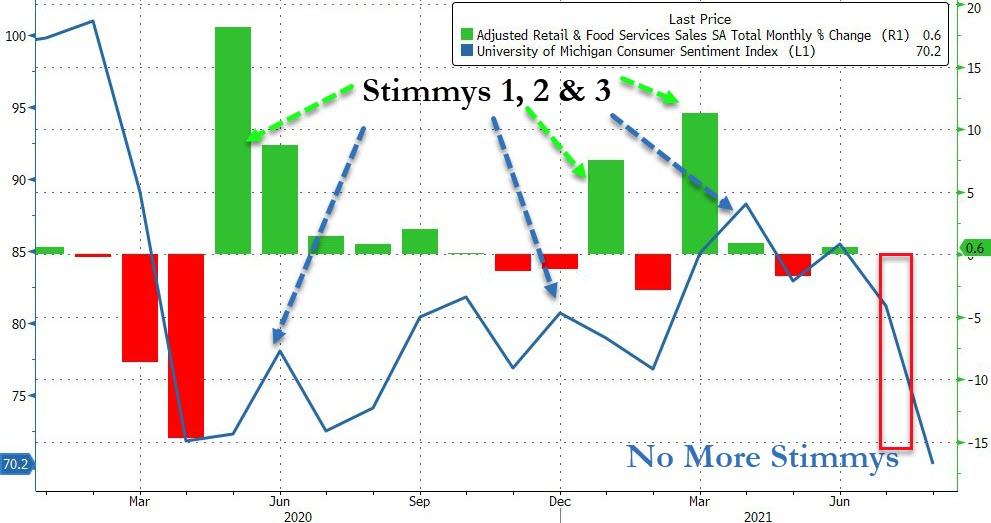
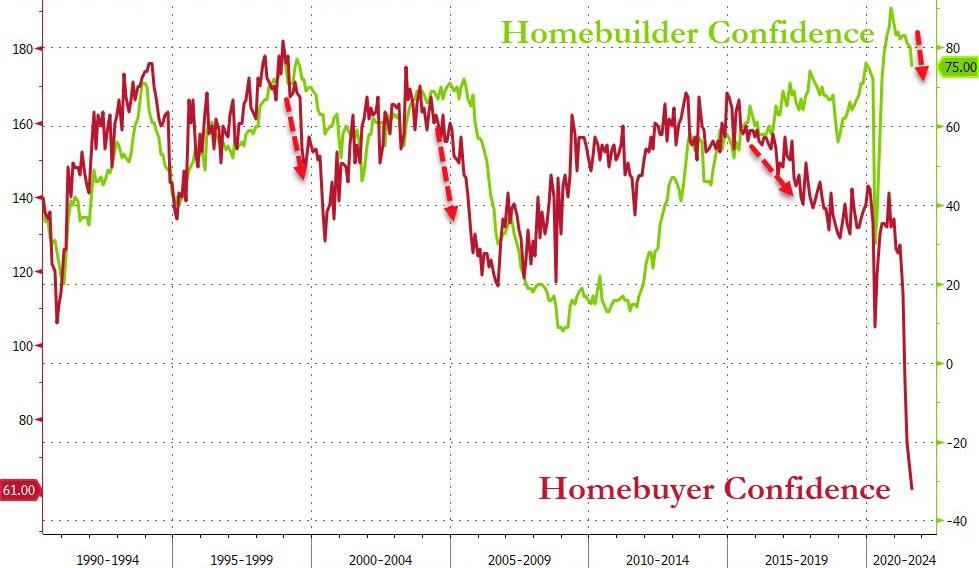
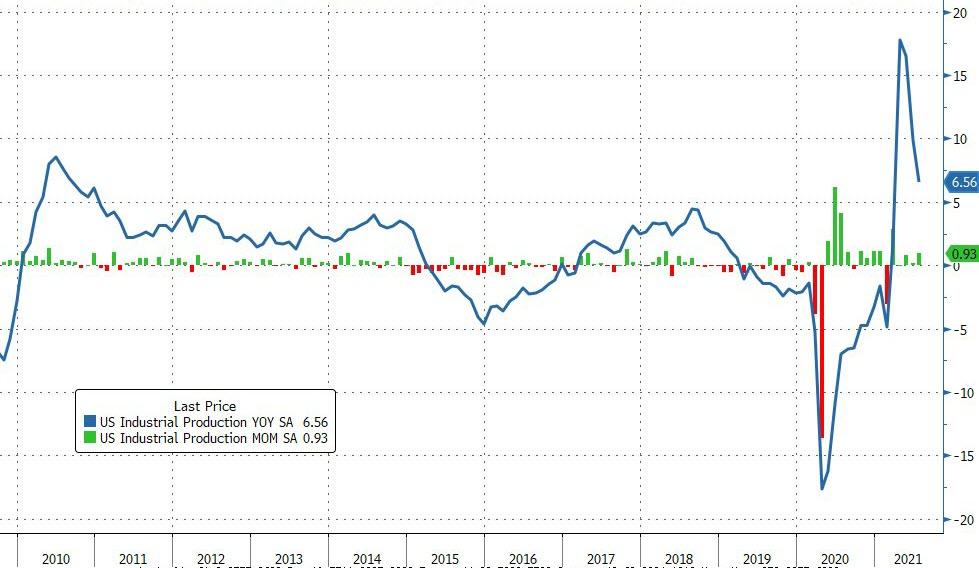
Contributing to the sour mood were declining retail sales, as the artificial boom created by almost 18 months of “stimmy checks” had worn off. Other econ data points were mixed with Homebuilder Confidence collapsing to 13-month lows, but US Industrial Production showed some hope with its indicator rising 0.9% MoM, which is the 5th straight month of increases.
Still, signs about a slowing economy are present, causing ZeroHedge to state:
Well, we were right: 3 months later, with China bracing for a softish (if not much harder) landing, with countries imposing Covid lockdowns all over again, and with the US consumer tapped out and no longer spending like a drunken sailor, the peak is long behind us and the painful return of gravity – and stimmy-free reality – is back on deck…
Home Depot disappointed and dropped 4% despite topping estimates, but it was the same-store sales numbers that analysts focused on, and they were below expectations.
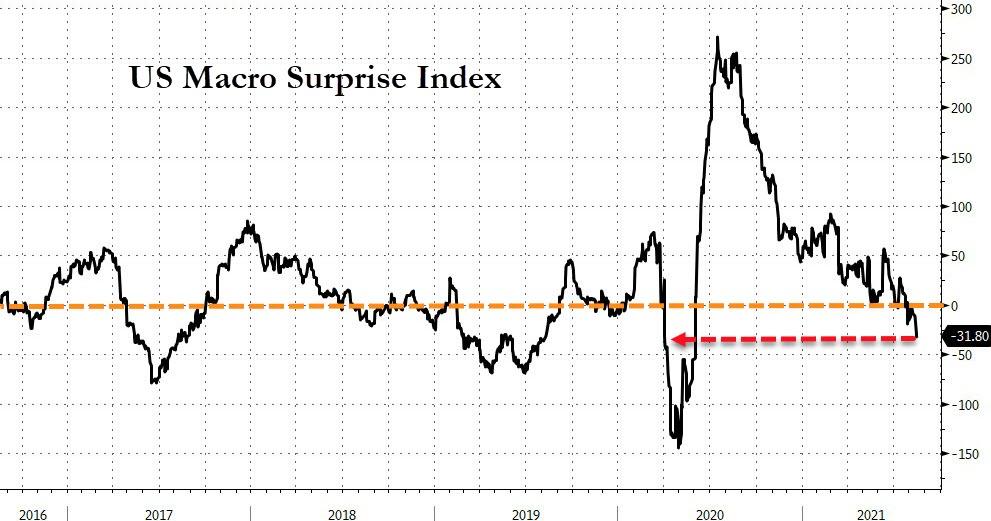
The “growth scare” continues as US Macro data is declining/disappointing at the fastest rate since March 2020, as ZH put it. To me, this type of reality must set in when a so-called recovery is based nothing but hot air via reckless money creation without an offsetting increase in production.
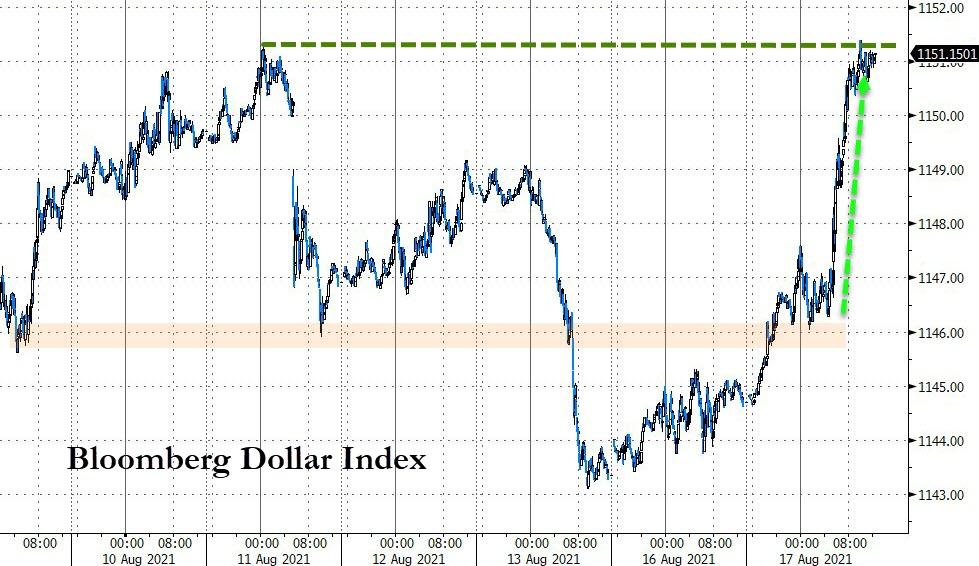
The US Dollar rocketed today and touched last week’s highs, while bond yields meandered aimlessly below the unchanged line with 10-Year dropping to 1.26%. Gold held up surprisingly well, given the massive dollar jump, with the precious metal only giving up -0.16%.
2. ETFs in the Spotlight
In case you missed the announcement and description of this section, you can read it here again.
It features some of the 10 broadly diversified domestic and sector ETFs from my HighVolume list as posted every Saturday. Furthermore, they are screened for the lowest MaxDD% number meaning they have been showing better resistance to temporary sell offs than all others over the past year.
The below table simply demonstrates the magnitude with which these ETFs are fluctuating above or below their respective individual trend lines (%+/-M/A). A break below, represented by a negative number, shows weakness, while a break above, represented by a positive percentage, shows strength.
For hundreds of ETF choices, be sure to reference Thursday’s StatSheet.
For this current domestic “Buy” cycle, here’s how some our candidates have fared:
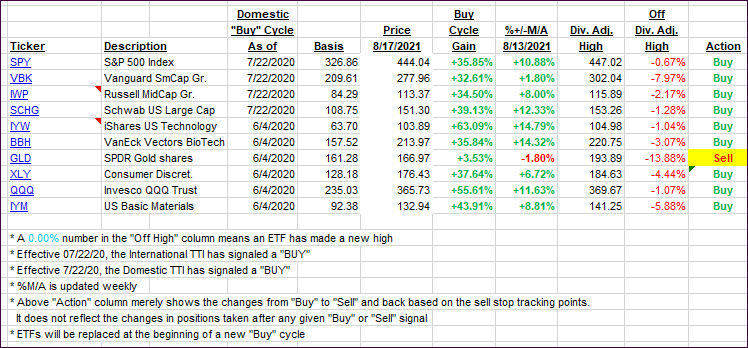
Click image to enlarge.
Again, the %+/-M/A column above shows the position of the various ETFs in relation to their respective long-term trend lines, while the trailing sell stops are being tracked in the “Off High” column. The “Action” column will signal a “Sell” once the -8% point has been taken out in the “Off High” column. For more volatile sector ETFs, the trigger point is -10%.
3. Trend Tracking Indexes (TTIs)
Our TTIs pulled back, as the bulls were not able to overcome poor economic news.
This is how we closed 08/17/2021:
Domestic TTI: +9.81% above its M/A (prior close +10.65%)—Buy signal effective 07/22/2020.
International TTI: +6.47+% above its M/A (prior close +7.43%)—Buy signals effective 07/22/2020.
Disclosure: I am obliged to inform you that I, as well as my advisory clients, own some of the ETFs listed in the above table. Furthermore, they do not represent a specific investment recommendation for you, they merely show which ETFs from the universe I track are falling within the specified guidelines.
All linked charts above are courtesy of Bloomberg via ZeroHedge.
Contact Ulli