Below, please find the latest High-Volume ETF Cutline report, which shows how far above or below their respective long-term trend lines (39-week SMA) my currently tracked ETFs are positioned.
This report covers the HV ETF Master List from Thursday’s StatSheet and includes 312 High Volume ETFs, defined as those with an average daily volume of more than $5 million, of which currently 251 (last week 253) are hovering in bullish territory. The yellow line separates those ETFs that are positioned above their trend line (%M/A) from those that have dropped below it.
In case you are not familiar with some of the terminology used in the reports, please read the Glossary of Terms. If you missed the original post about the Cutline approach, you can read it here.
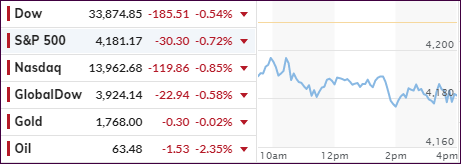
The futures markets already indicated a weak opening with traders deciding, despite good economic data and some blockbuster earnings (Amazon) but also some disappointments (Twitter), to cash in some of their chips.
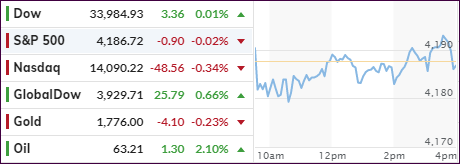
As a result, the major indexes hovered in the red all day and closed with acceptable losses, considering that for the month the S&P 500 gained some 5%. The pullback was broad based with only a couple sectors sporting modestly green numbers.
For the month of April, all equity indexes scored gains with the Nasdaq in the lead and Small Caps lagging. Even Gold managed to climb some 3.5%, but the US Dollar continued its slide, down almost 2%, which was its first monthly loss since December 2020, according to ZH.
Not everyone thinks we are in a “Goldilocks” environment:
“The fact that 95% of the S&P 500 is now above its 200-day moving average is NOT a bullish sign,” Matt Maley, chief market strategist for Miller Tabak + Co., wrote in an April 26 note.
“Yes, a high number of stocks above their 200 DMA’s is usually positive, BUT it is NOT bullish when the number becomes extreme (like it is now…at 95%). In other words, this data point is much like sentiment. When it is strong, it is positive…but when it becomes extreme, it becomes a contrarian indicator!”
Maybe so, but right now the major trend remains up, but should it reverse, we have our exit strategy in place and will be ready pull the trigger, should the need arise.
1. From the universe of over 1,800 ETFs, I have selected only those with a trading volume of over $5 million per day (HV ETFs), so that liquidity and a small bid/ask spread are assured.
2. Trend Tracking Indexes (TTIs)
Buy or Sell decisions for Domestic and International ETFs (section 1 and 2), are made based on the respective TTI and its position either above or below its long-term M/A (Moving Average). A crossing of the trend line from below accompanied by some staying power above constitutes a “Buy” signal. Conversely, a clear break below the line constitutes a “Sell” signal. Additionally, I use an 8% trailing stop loss on all positions in these categories to control downside risk.
3. All other investment arenas do not have a TTI and should be traded based on the position of the individual ETF relative to its own respective trend line (%M/A). That’s why those signals are referred to as a “Selective Buy.” In other words, if an ETF crosses its own trendline to the upside, a “Buy” signal is generated. Since these areas tend to be more volatile, I recommend a wider trailing sell stop of 8%-10% depending on your risk tolerance.
If you are unfamiliar with some of the terminology, please see Glossary of Termsand new subscriber information in section 9.
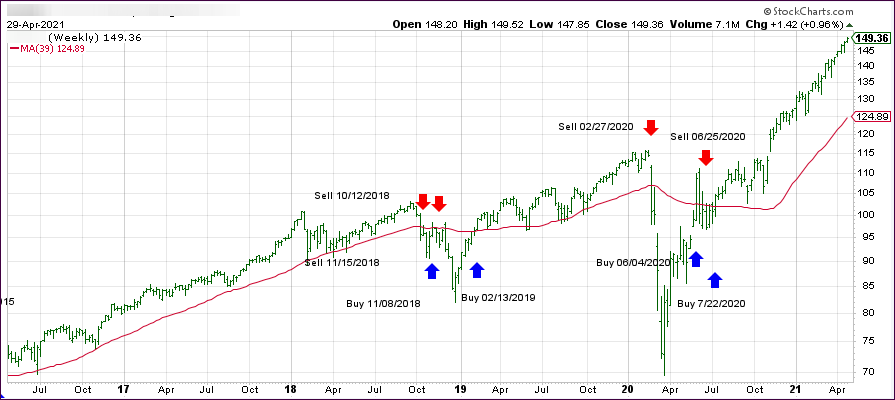
1. DOMESTIC EQUITY ETFs: BUY— since 07/22/2020
Click on chart to enlarge
Our main directional indicator, the Domestic Trend Tracking Index (TTI-green line in the above chart) has now rallied above its long-term trend line (red) by +20.68% and remains in “BUY” mode as posted.
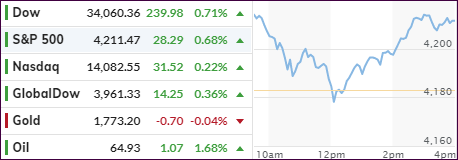
The S&P 500 managed to find some footing, after a mid-day gag caused by surging bond yields, and scored another record close, powered by blowout earnings from the tech sector, namely Apple and Facebook. Despite their solid performances, the Nasdaq lagged the other two major indexes for the day by a wide margin.
On the economic front, we learned that 1st quarter GDP was reported at “only 6.4%,” which missed expectations of 6.6% but, is an improvement to the Q4 number of 4.3% The question that ZeroHedge posted “Is this all the growth that $2 trillion in stimulus can buy?” remains a valid one, and it casts doubt on the effects of future reckless money printing in terms what it can really accomplish.
Pending Home Sales disappointed due to low inventory, while last week’s Initial Jobless Claims totaled 553k, just a tad worse than the 528k estimated by Dow Jones.
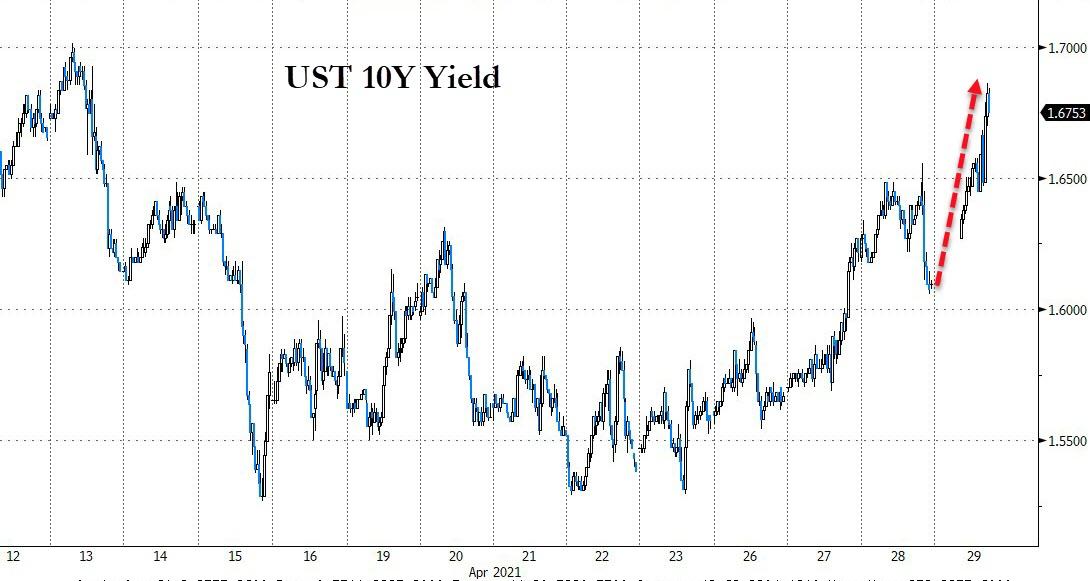
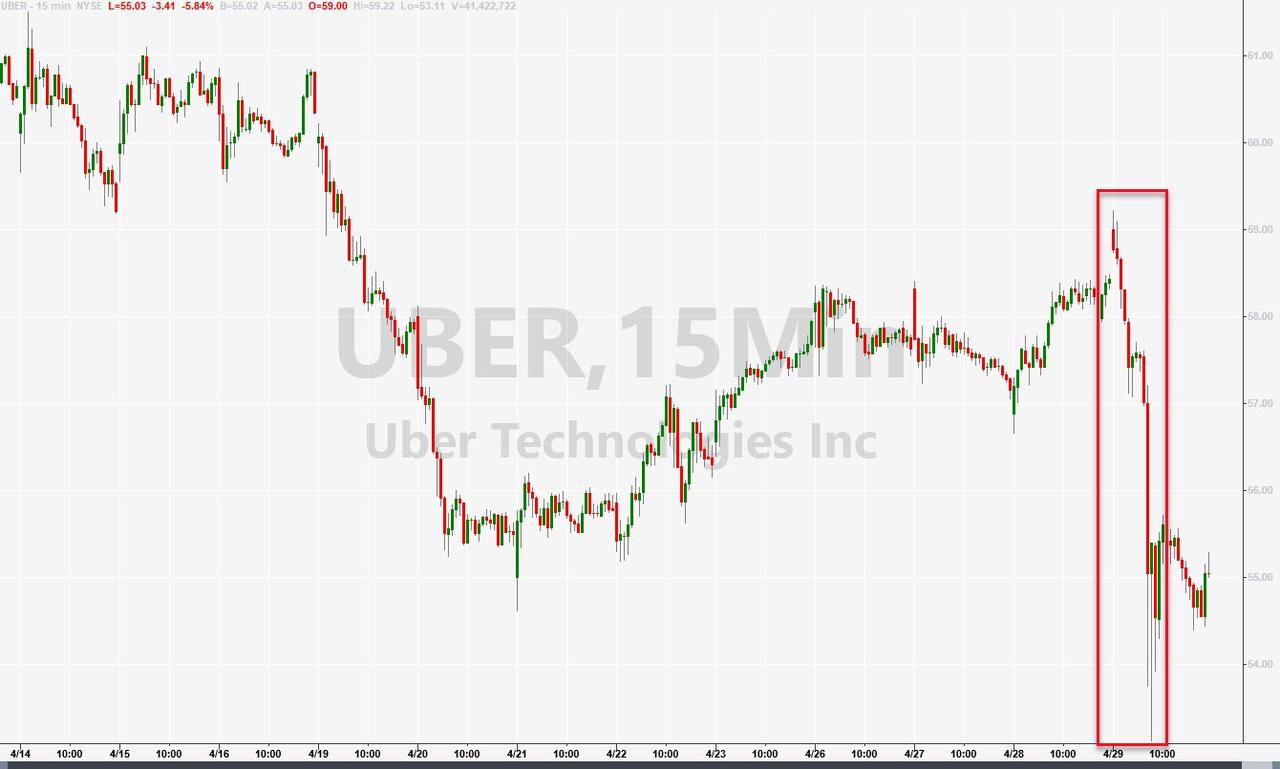
Crowd favorites Uber and Lyft were manhandled today and got battered after Biden’s plan to make gig workers employees. Bond yields rode the roller coaster by popping and dropping as Bloomberg shows in this chart. The US Dollar roundtripped as well, sold off into the close but managed to eke out a gain. Gold followed suit but ended the session flat.
While uncertainty played havoc with the markets intraday, in the end, the bulls managed to keep the upper hand when it counted most, namely at the close.
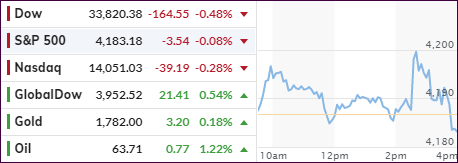
While the futures were flat, the regular session opened with a bounce for the S&P 500, while the Dow and Nasdaq hovered below their respective unchanged lines. In the end, all three indexes meandered aimlessly all day and ended slightly in the red.
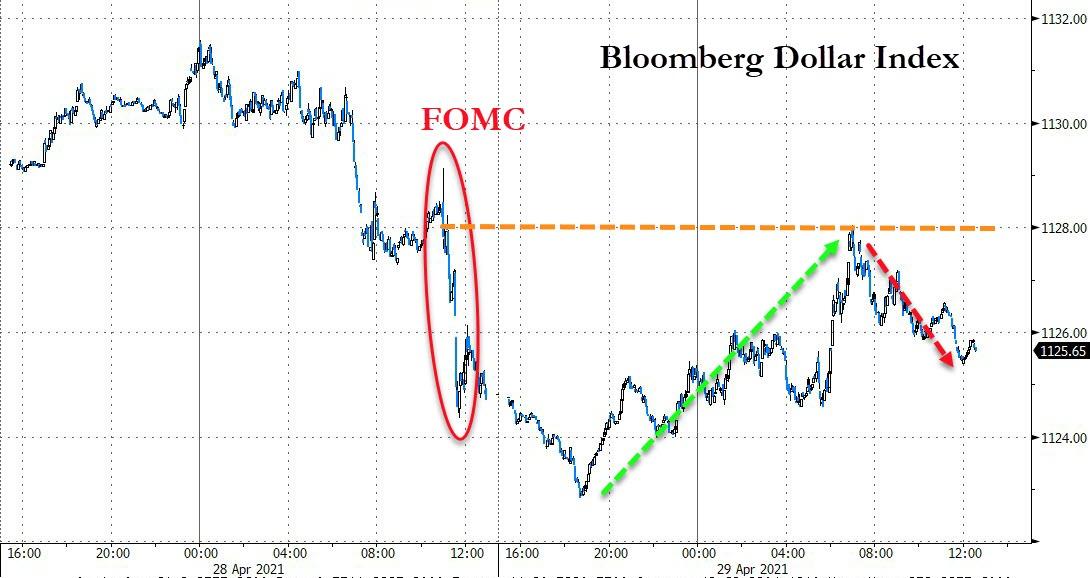
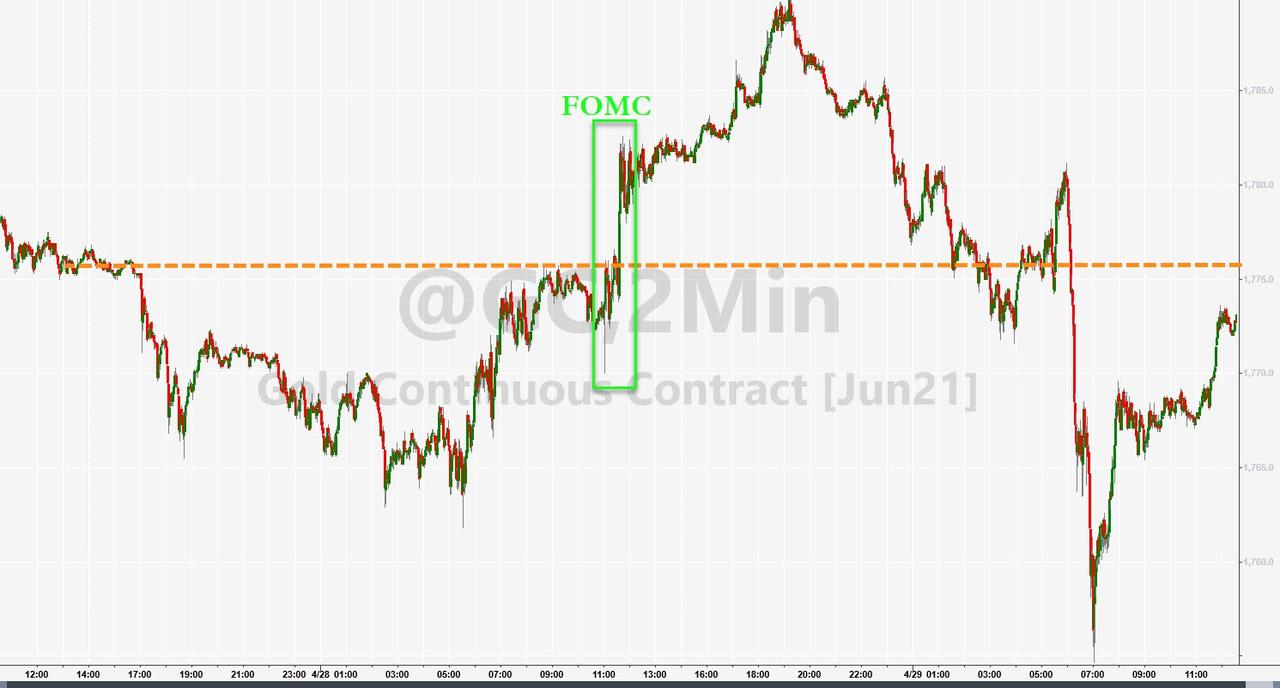
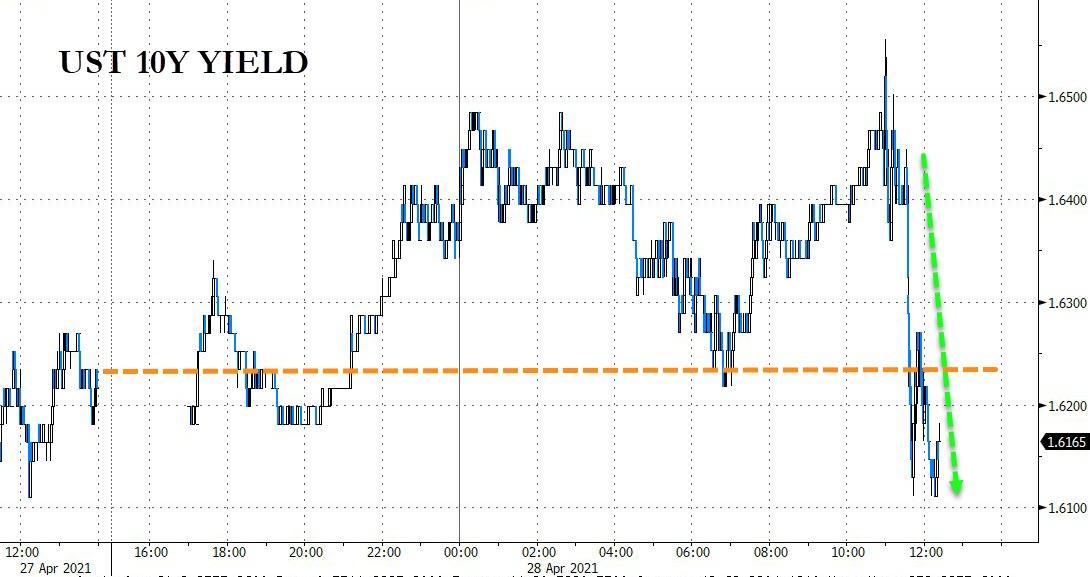
The much-expected Fed announcement was a nothing burger with no changes in policy neither in terms of tapering bond purchases nor any potential hike in interest rates. The statement was dovish with optimistic soundbites being offset by downbeat ones, as ZH posted:
…economic activity and employment have strengthened.
Amid progress on vaccinations and strong policy support, indicators of economic activity and employment have strengthened.
The sectors most adversely affected by the pandemic remain weak but have shown improvement.
Yet:
The ongoing public health crisis continues to weigh on the economy, and risks to the economic outlook remain.
And most importantly, “inflation has risen, largely reflecting transitory factors.”
In other words, there was no meat on that bone, neither for the bulls nor for the bears, so we ended up going nowhere.
The US Dollar slumped to two-month lows, according to ZH, with bond yields heading south as well, a combination which benefited Gold, but only moderately.
The Nasdaq showed no bullishness either, despite Google parent Alphabet reporting better-than-expected earnings after the bell on Tuesday with its shares rallying 3%. That was offset by Microsoft topping analysts’ estimates as well, yet the stock dipped 2.8%. Go figure…
All eyes are now on Joe Biden’s $1.8 trillion plan in new spending as well as tax credits for families in need. Higher income tax rates and an increase in capital gains taxes will make tonight’s showing one to remember.
After having closed at record levels yesterday, the S&P 500 and Nasdaq traded aimlessly around their respective unchanged lines, with the Dow treading water as well. The Nasdaq has now finalized a rebound from its 11% correction, which began in February.
Tesla shares retreated some 3% despite the company posting a record net income, while UPS shares rallied over 10%, as the company’s revenue was up 27%.
However, this was just the warmup for the big boys with Alphabet, Microsoft and AMD reporting this afternoon, as Apple and Facebook are due up after tomorrow’s close.
On the economic front, we learned that home prices recorded their biggest gain in 15 years. Consumer Confidence also rose sharply to its highest since February 2020.
Despite the relative calm, SmallCaps had a wild ride on a bronco by pumping and dumping after the opening and again into the close.
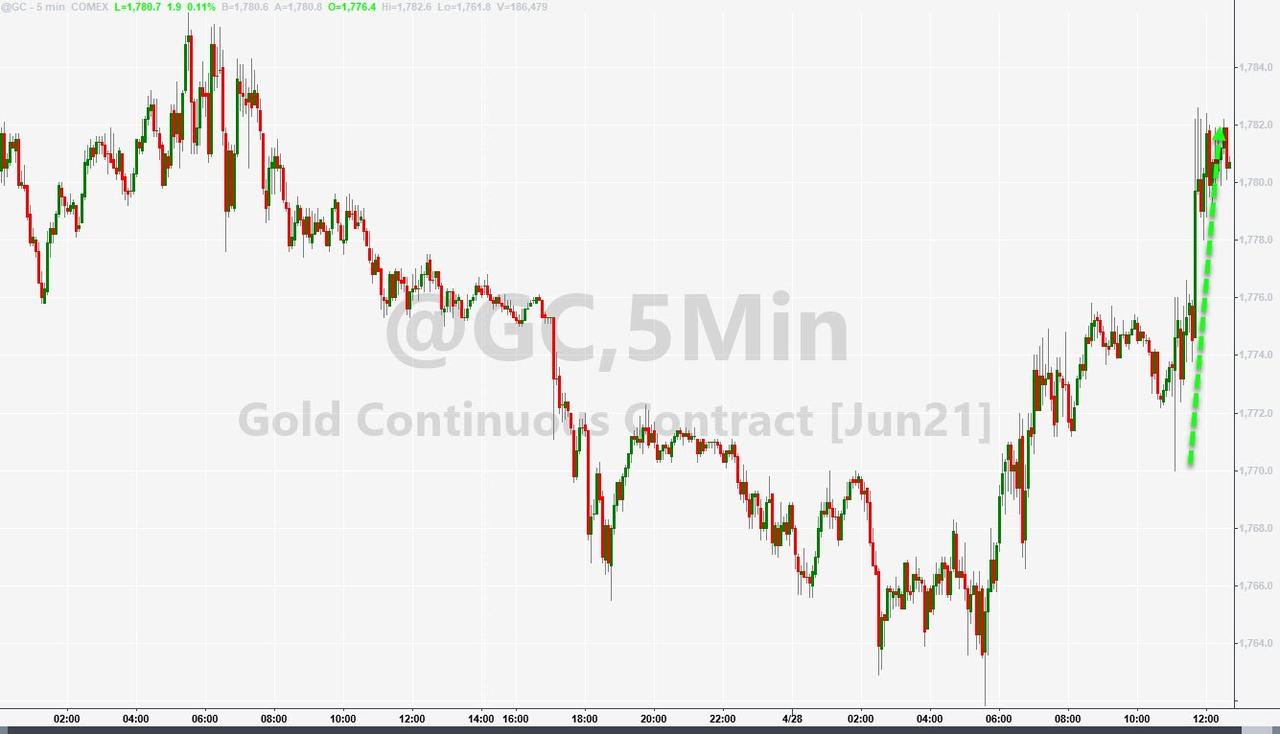
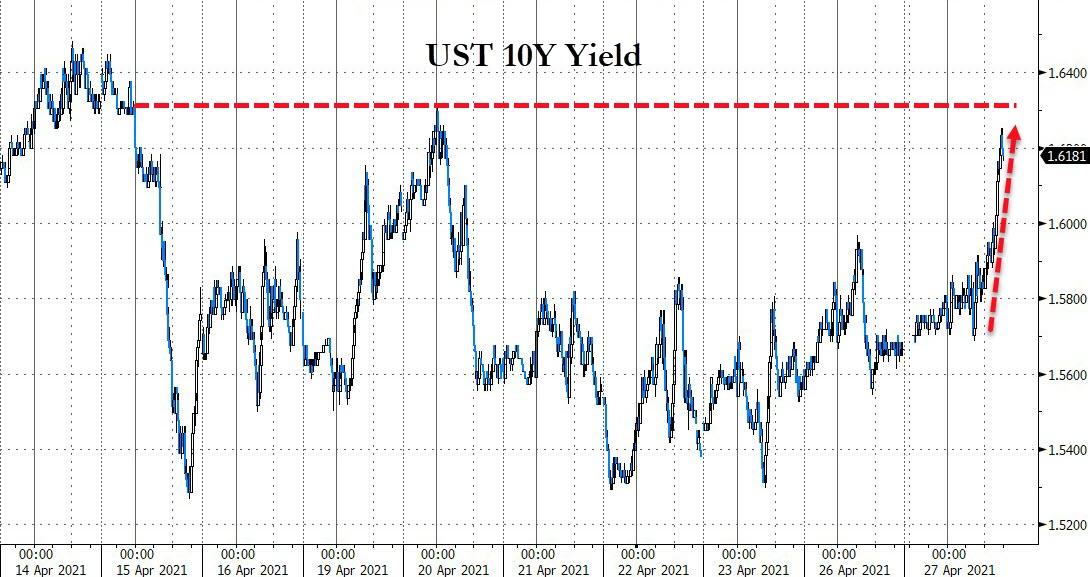
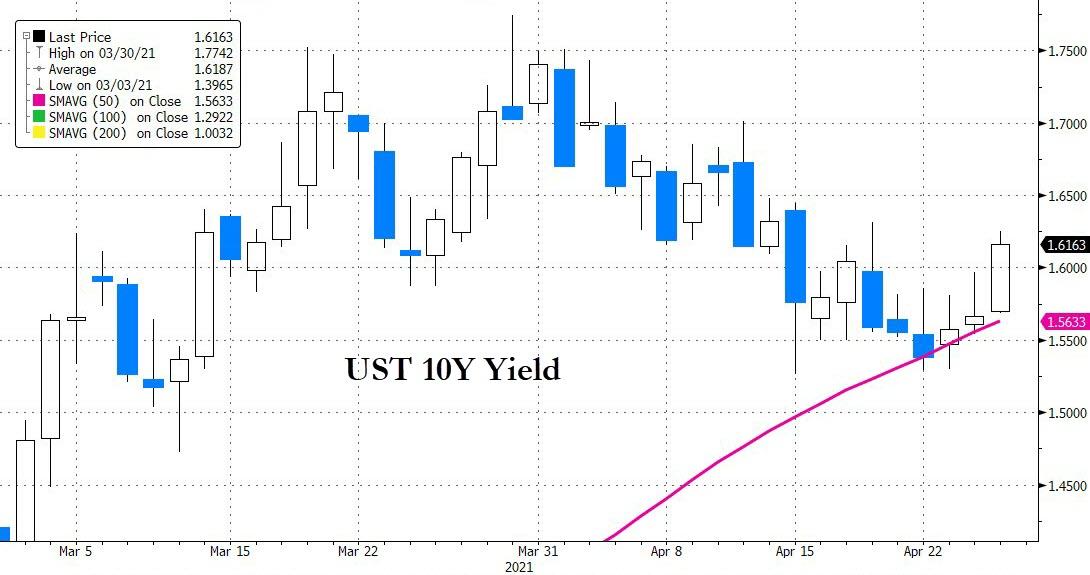
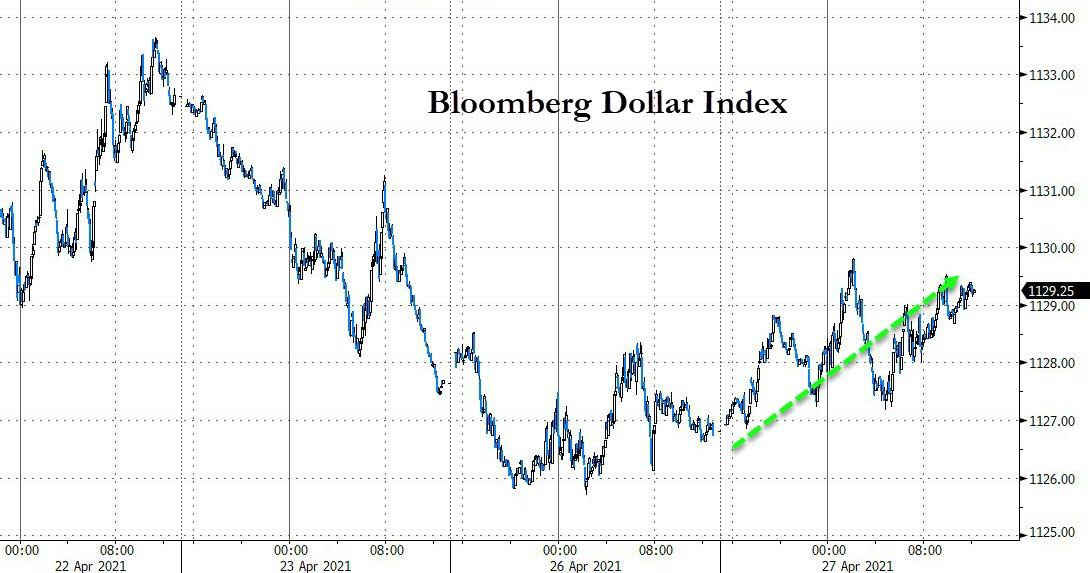
Ahead of tomorrow’s FOMC meeting, bonds sold off as yields rose with the 10-year being supported by its 50-day M/A, according to ZH/Bloomberg. This helped the US Dollar to finally rebound, causing Gold to dip slightly.
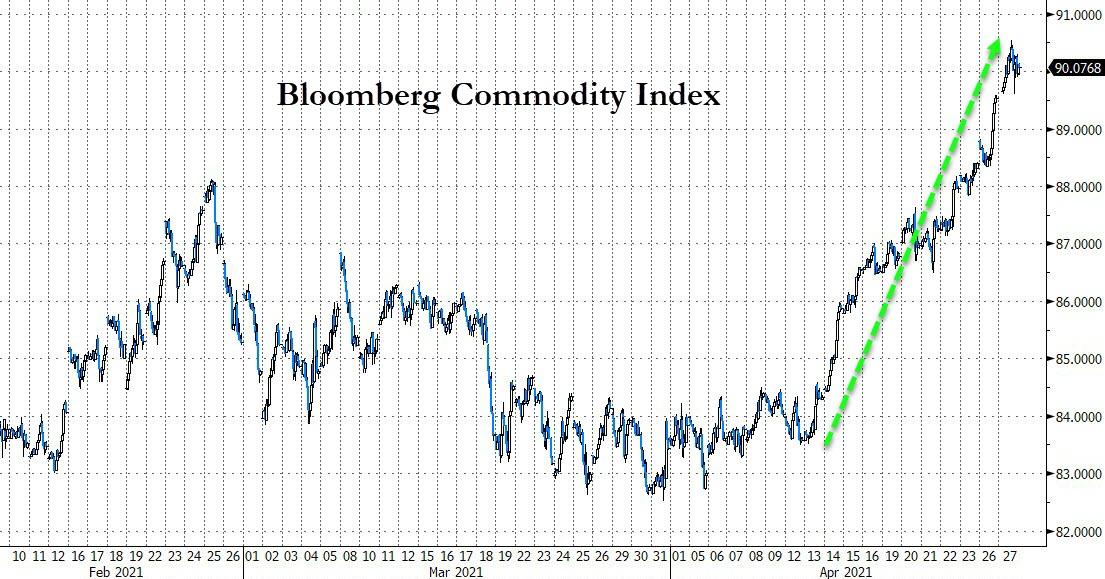
It’s been now the 11th straight day that Commodities have risen, as Bloomberg demonstrates here. Yet, the Fed refuses to acknowledge that inflation is accelerating, or could even be a threat to this economy, and considers it simply transitory. Yeah right.

