
ETF Tracker StatSheet
You can view the latest version here.
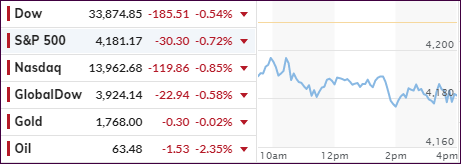
EQUITIES SLUMP ON LAST DAY OF APRIL
- Moving the markets
The futures markets already indicated a weak opening with traders deciding, despite good economic data and some blockbuster earnings (Amazon) but also some disappointments (Twitter), to cash in some of their chips.
As a result, the major indexes hovered in the red all day and closed with acceptable losses, considering that for the month the S&P 500 gained some 5%. The pullback was broad based with only a couple sectors sporting modestly green numbers.
For the month of April, all equity indexes scored gains with the Nasdaq in the lead and Small Caps lagging. Even Gold managed to climb some 3.5%, but the US Dollar continued its slide, down almost 2%, which was its first monthly loss since December 2020, according to ZH.
Not everyone thinks we are in a “Goldilocks” environment:
“The fact that 95% of the S&P 500 is now above its 200-day moving average is NOT a bullish sign,” Matt Maley, chief market strategist for Miller Tabak + Co., wrote in an April 26 note.
“Yes, a high number of stocks above their 200 DMA’s is usually positive, BUT it is NOT bullish when the number becomes extreme (like it is now…at 95%). In other words, this data point is much like sentiment. When it is strong, it is positive…but when it becomes extreme, it becomes a contrarian indicator!”
Maybe so, but right now the major trend remains up, but should it reverse, we have our exit strategy in place and will be ready pull the trigger, should the need arise.
2. ETFs in the Spotlight
In case you missed the announcement and description of this section, you can read it here again.
It features some of the 10 broadly diversified domestic and sector ETFs from my HighVolume list as posted every Saturday. Furthermore, they are screened for the lowest MaxDD% number meaning they have been showing better resistance to temporary sell offs than all others over the past year.
The below table simply demonstrates the magnitude with which these ETFs are fluctuating above or below their respective individual trend lines (%+/-M/A). A break below, represented by a negative number, shows weakness, while a break above, represented by a positive percentage, shows strength.
For hundreds of ETF choices, be sure to reference Thursday’s StatSheet.
For this current domestic “Buy” cycle, here’s how some our candidates have fared:
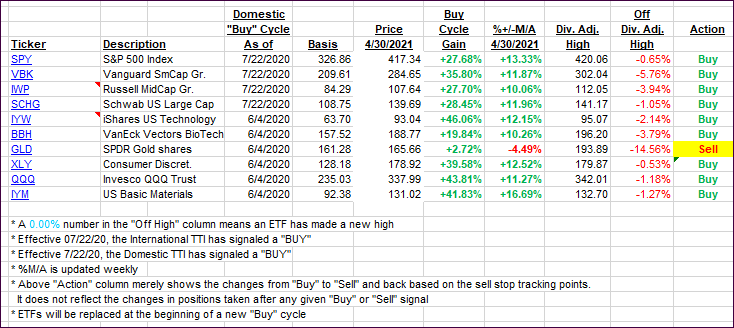
Click image to enlarge.
Again, the %+/-M/A column above shows the position of the various ETFs in relation to their respective long-term trend lines, while the trailing sell stops are being tracked in the “Off High” column. The “Action” column will signal a “Sell” once the -8% point has been taken out in the “Off High” column. For more volatile sector ETFs, the trigger point is -10%.
3. Trend Tracking Indexes (TTIs)
Our TTIs retreated on the last trading day of April with the broad market slumping.
This is how we closed 4/30/2021:
Domestic TTI: +18.76% above its M/A (prior close +20.68%)—Buy signal effective 07/22/2020.
International TTI: +14.77% above its M/A (prior close +16.72%)—Buy signals effective 07/22/2020.
Disclosure: I am obliged to inform you that I, as well as my advisory clients, own some of the ETFs listed in the above table. Furthermore, they do not represent a specific investment recommendation for you, they merely show which ETFs from the universe I track are falling within the specified guidelines.
———————————————————-
WOULD YOU LIKE TO HAVE YOUR INVESTMENTS PROFESSIONALLY MANAGED?
Do you have the time to follow our investment plans yourself? If you are a busy professional who would like to have his portfolio managed using our methodology, please contact me directly or get more details here.
———————————————————
Back issues of the ETF Tracker are available on the web.
Contact Ulli