Below, please find the latest High-Volume ETF Cutline report, which shows how far above or below their respective long-term trend lines (39-week SMA) my currently tracked ETFs are positioned.
This report covers the HV ETF Master List from Thursday’s StatSheet and includes 312 High Volume ETFs, defined as those with an average daily volume of more than $5 million, of which currently 61 (last week 69) are hovering in bullish territory. The yellow line separates those ETFs that are positioned above their trend line (%M/A) from those that have dropped below it.
In case you are not familiar with some of the terminology used in the reports, please read the Glossary of Terms. If you missed the original post about the Cutline approach, you can read it here.
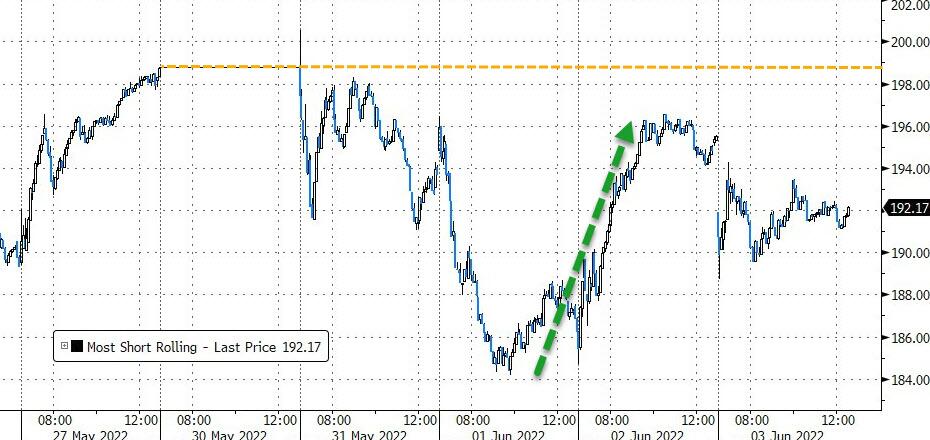
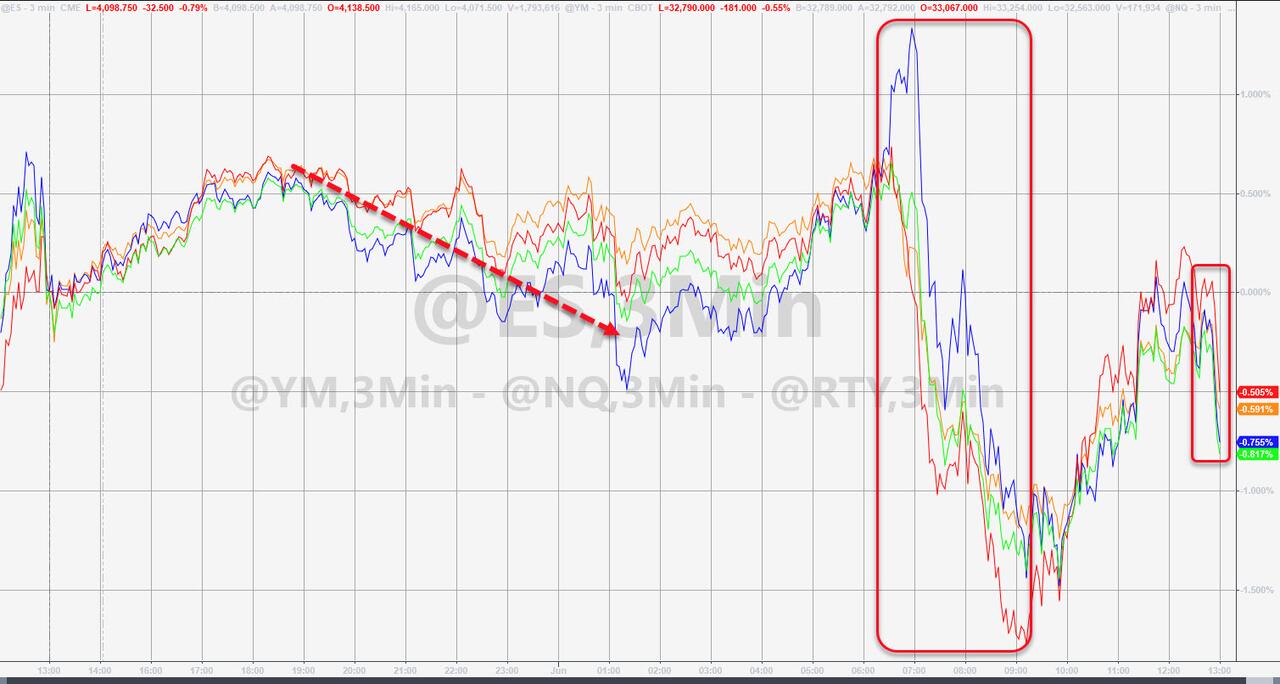
Sometimes you simply must shake your head and laugh out loud. Yesterday’s rally, AKA another dead-cat-bounce, was such an occasion, as headline news were peppered with bearish announcements such as “plunging productivity,” an “ugly ADP announcement,” followed by “disappointing factory orders” and “hawkish Fed talk.”
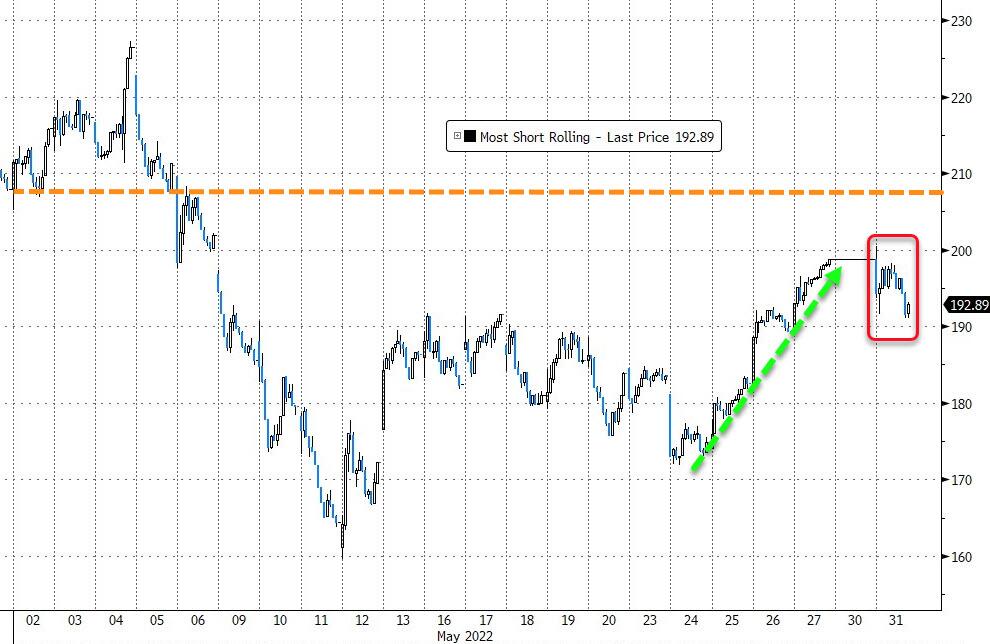
As a result, we witnessed another occurrence of “bad news is good news,” with the markets staging a Ramp-A-Thon, which sent the Dow up some 435 points.
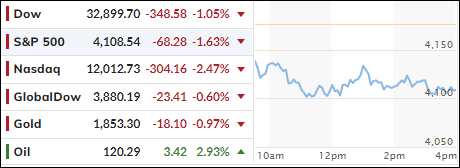
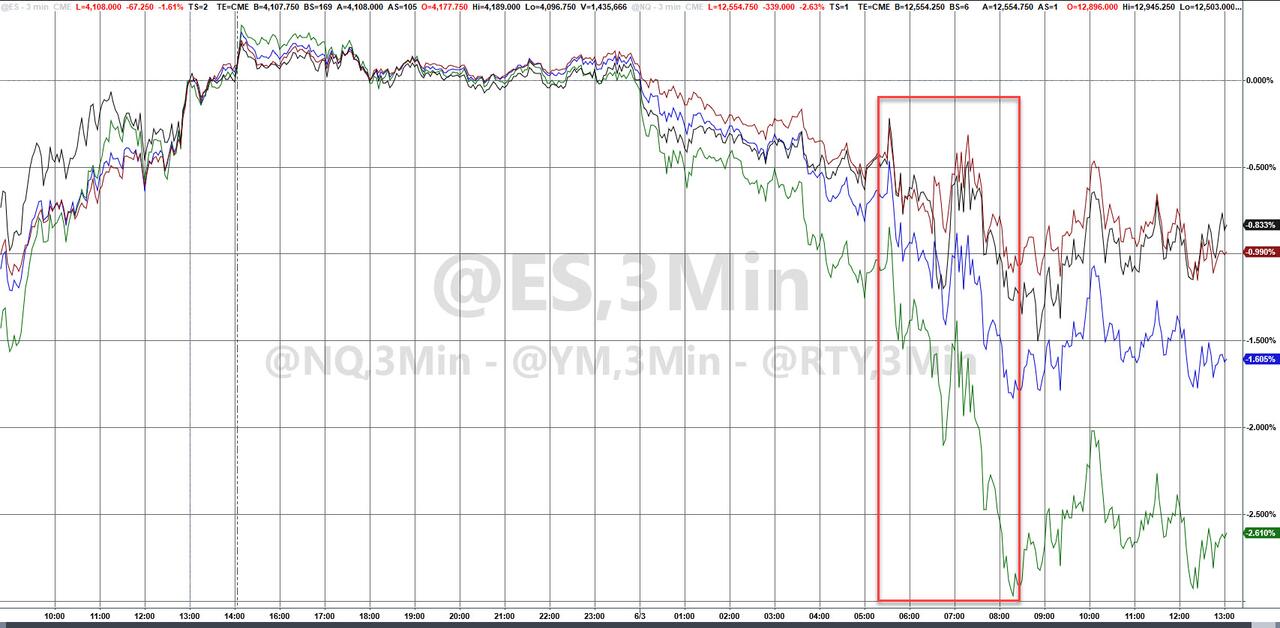
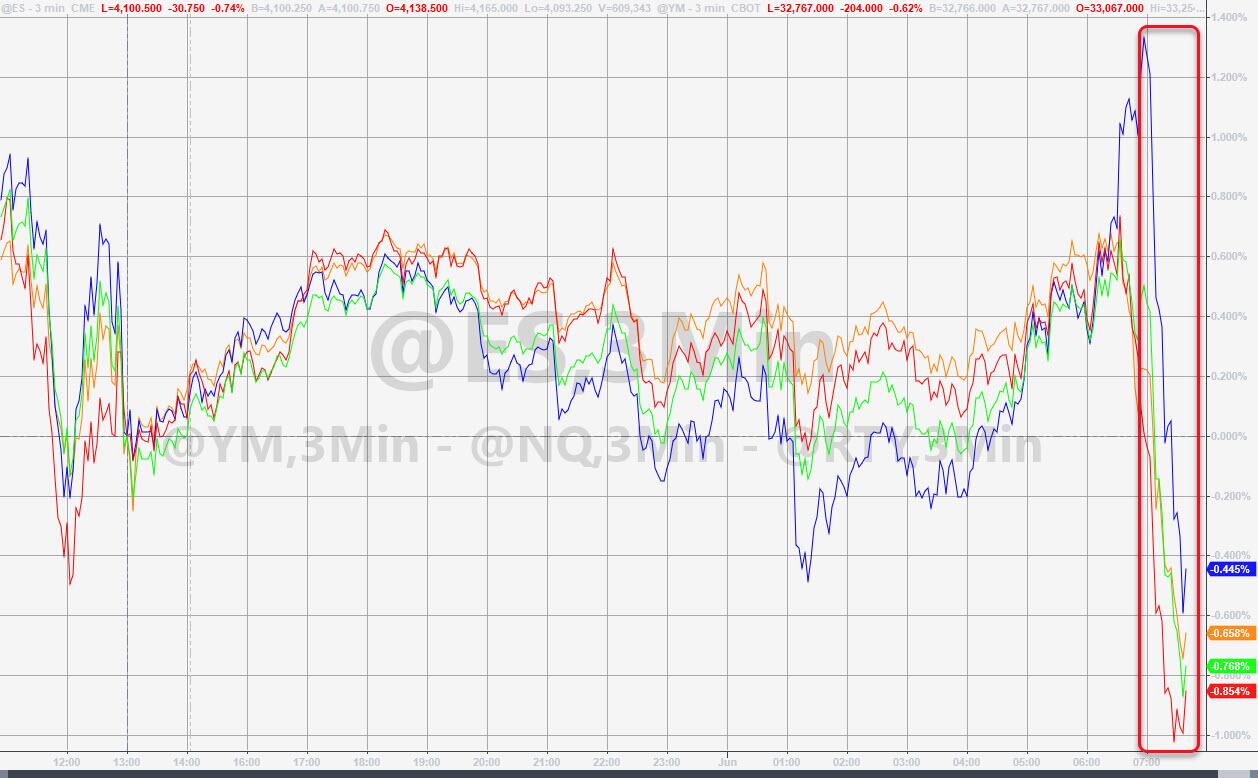
Fast forward to today, when reality set in, as yesterday’s bull fest turned into another head fake that forced the major indexes to the mat and not too far from where we started the day before.
Payrolls came in hotter than expected with the US adding 390k jobs in May, which was at a 13-month low, but it beat expectations of 320k. The numbers for March were revised downward from 428k to 398k, while April’s were revised upward from 428k to 436k.
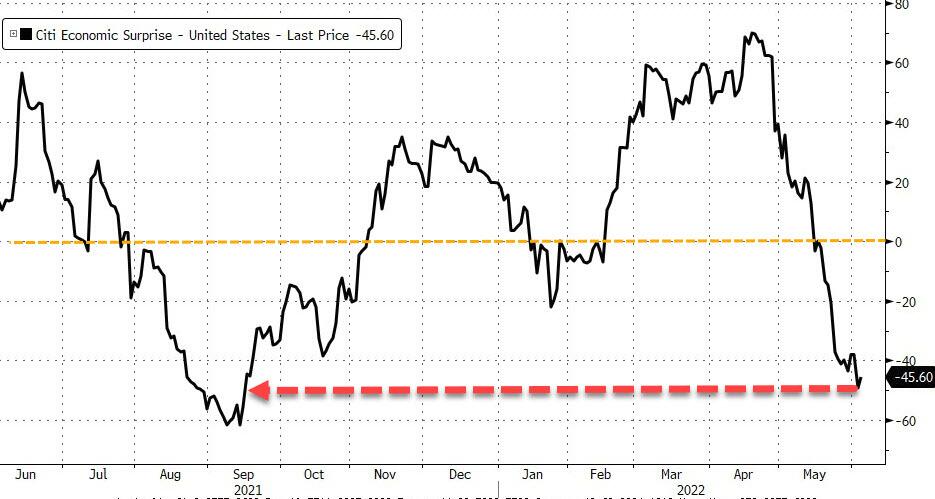
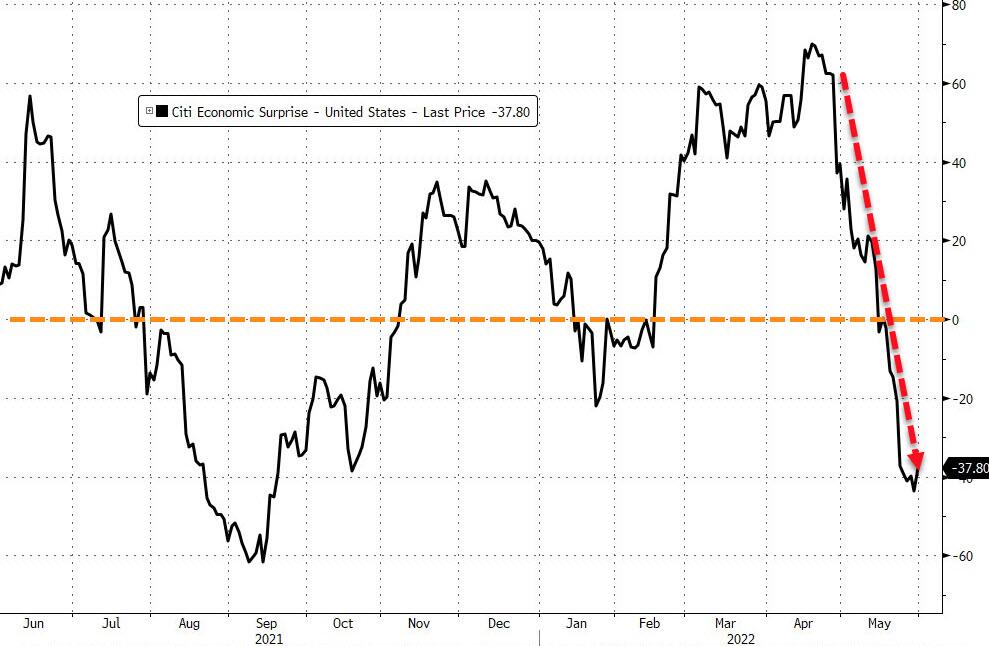
The state of the economy, as demonstrated via the Citi Surprise Index, clearly shows to be in crash mode, a condition that was not lost on Tesla’s Elon Musk, who said that he has a “super bad feeling about the economy,” and tweeted that “recessions serve a vital economic cleansing function,” the latter of which you will hear never being discussed on MSM.
A couple of bigwigs chimed in with Elon Musk’s assessment, which helped to punish equities. First, JPM’s Jamie Dimon downshifted his economic outlook from “clouds on the horizon” to “an imminent hurricane,” while Goldman’s President John Waldron added that “the shocks to the system are unprecedented,” as ZeroHedge reported.
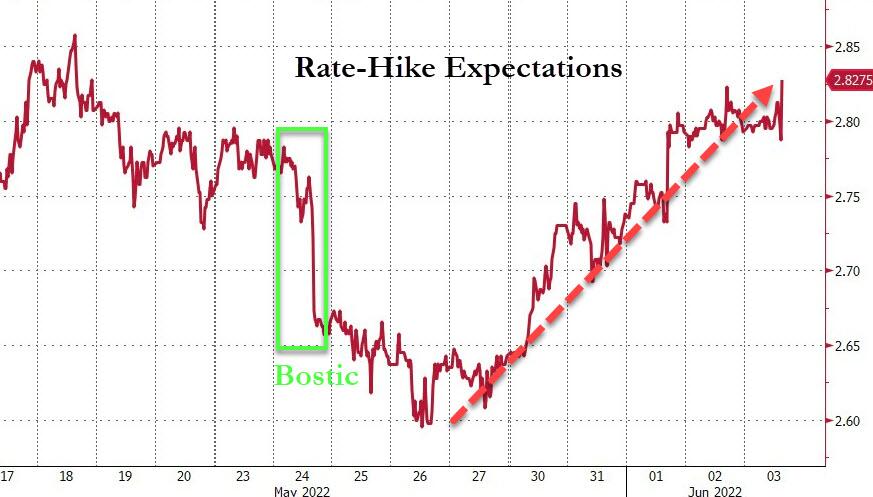
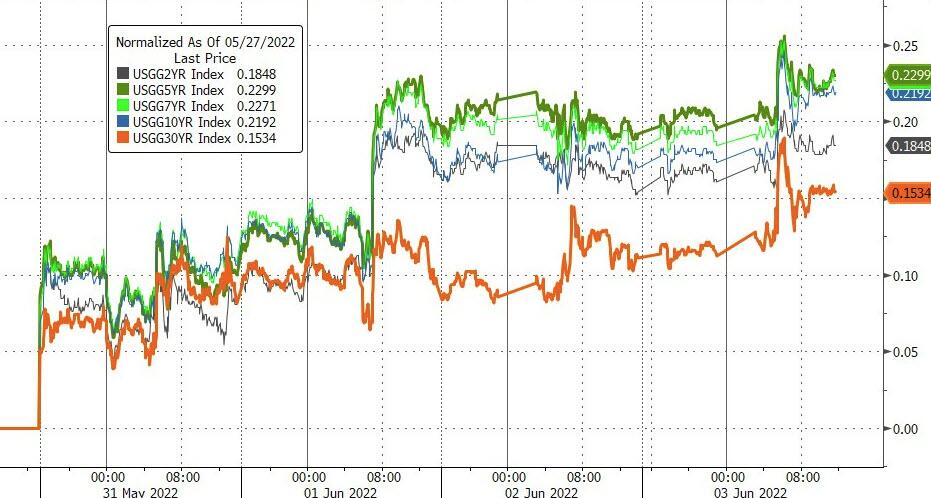
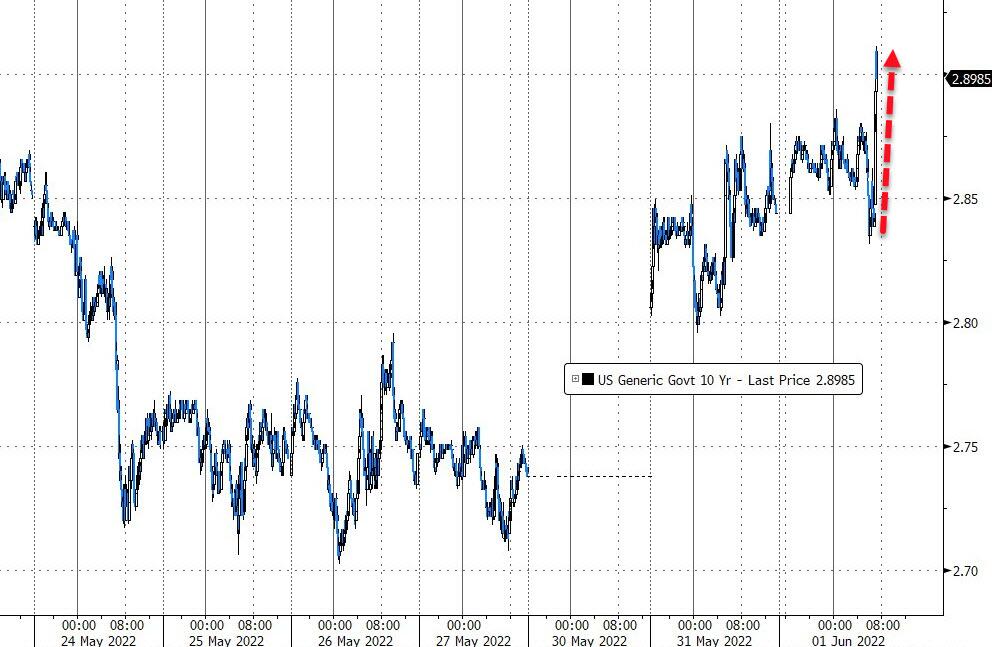
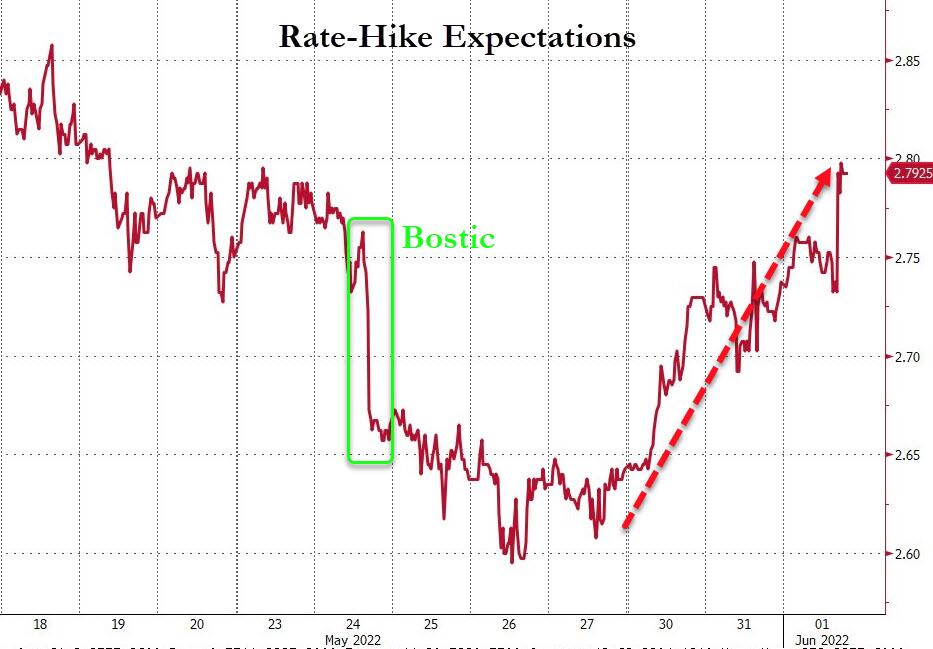
As a result, Rate Hike Expectations rose again, because the Fed’s rhetoric put the potential of higher rates and a non-pause in September back in traders’ minds.
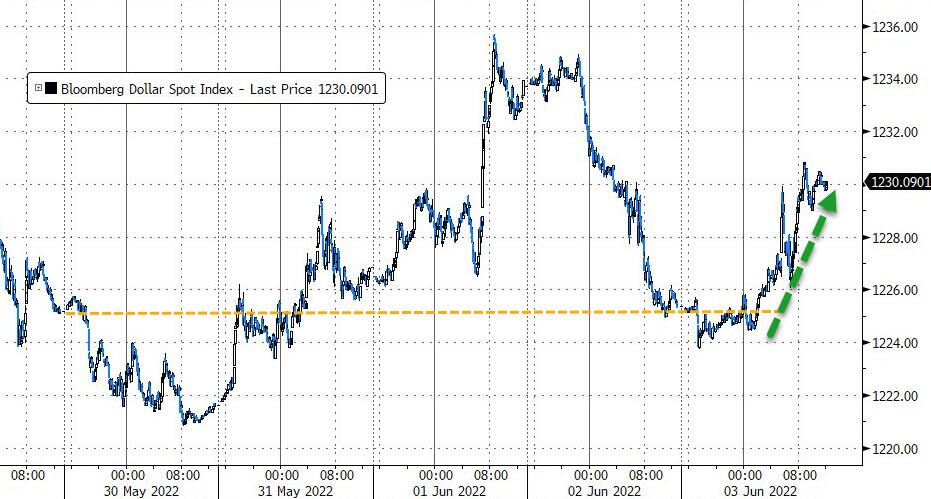
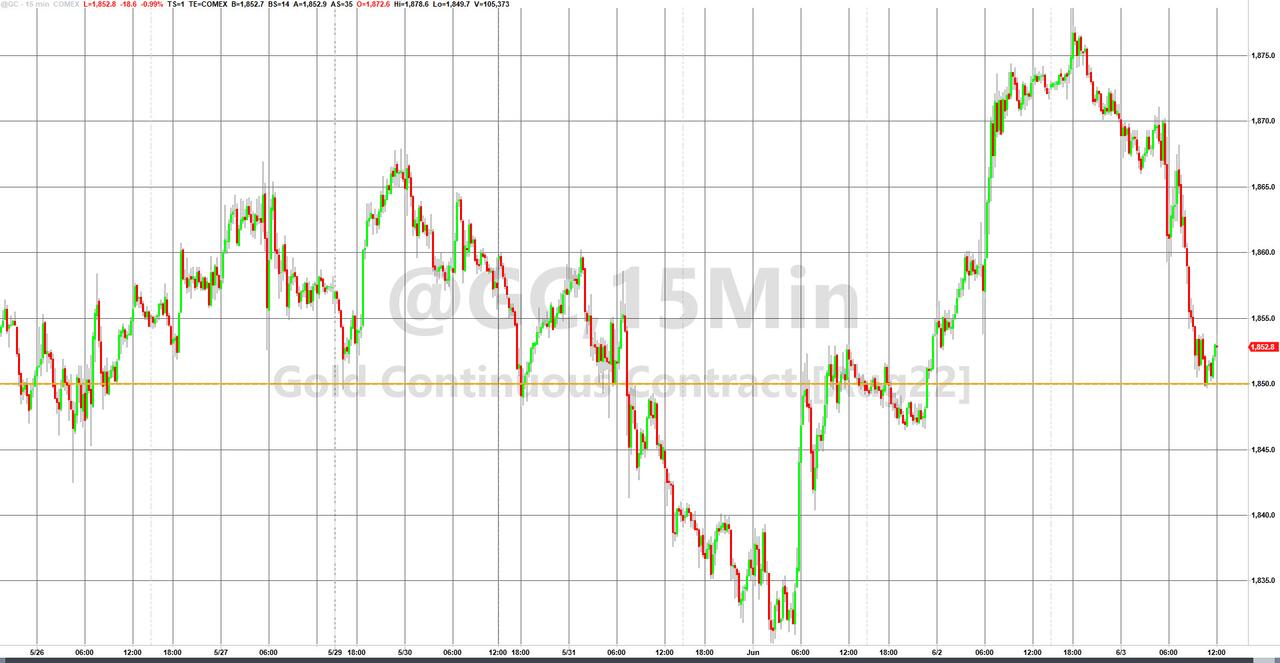
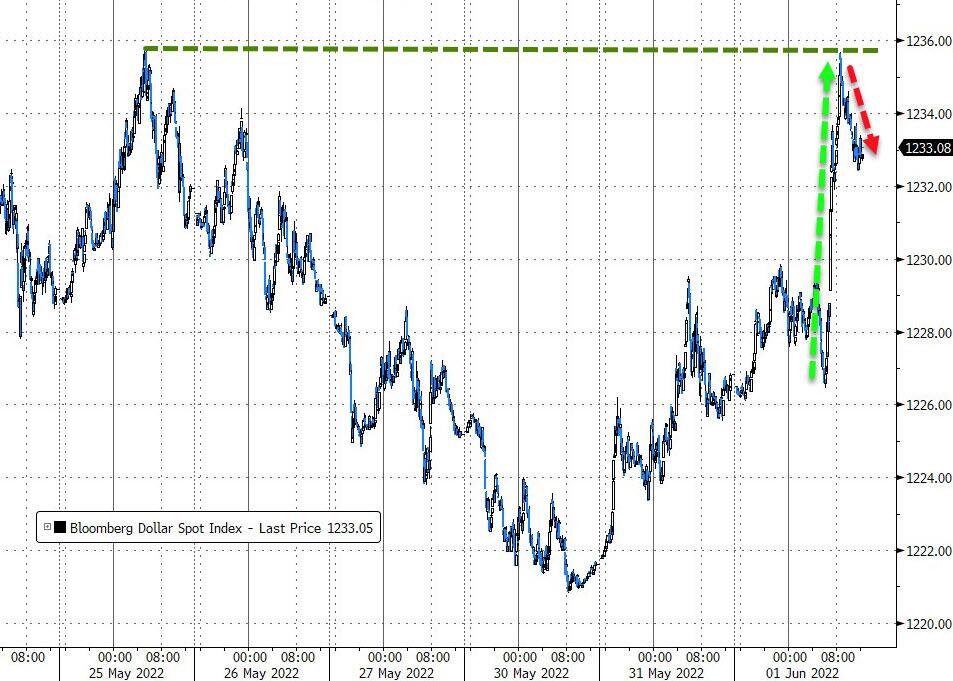
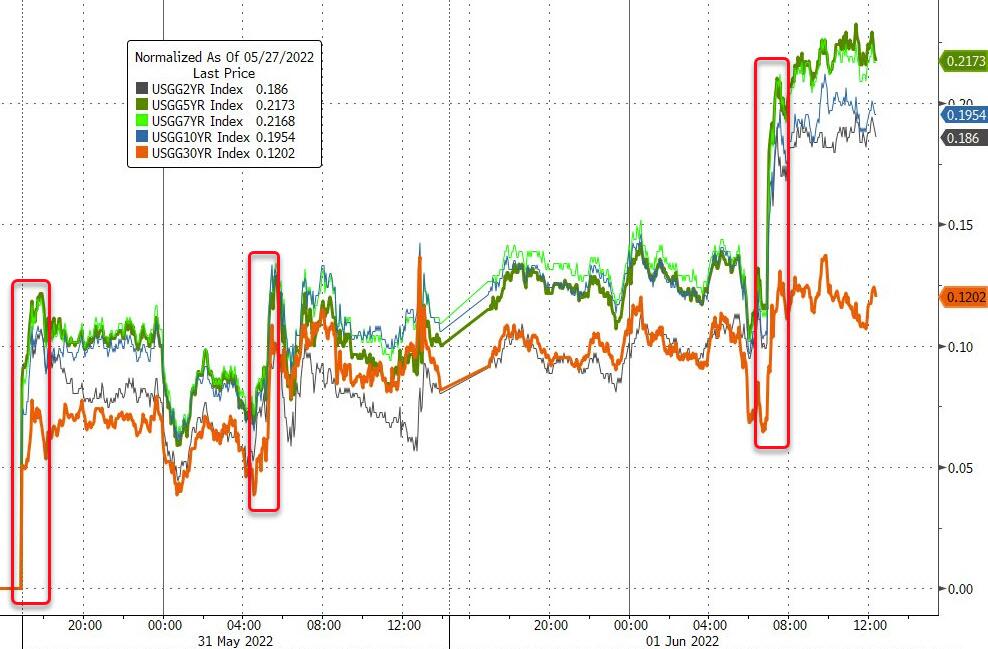
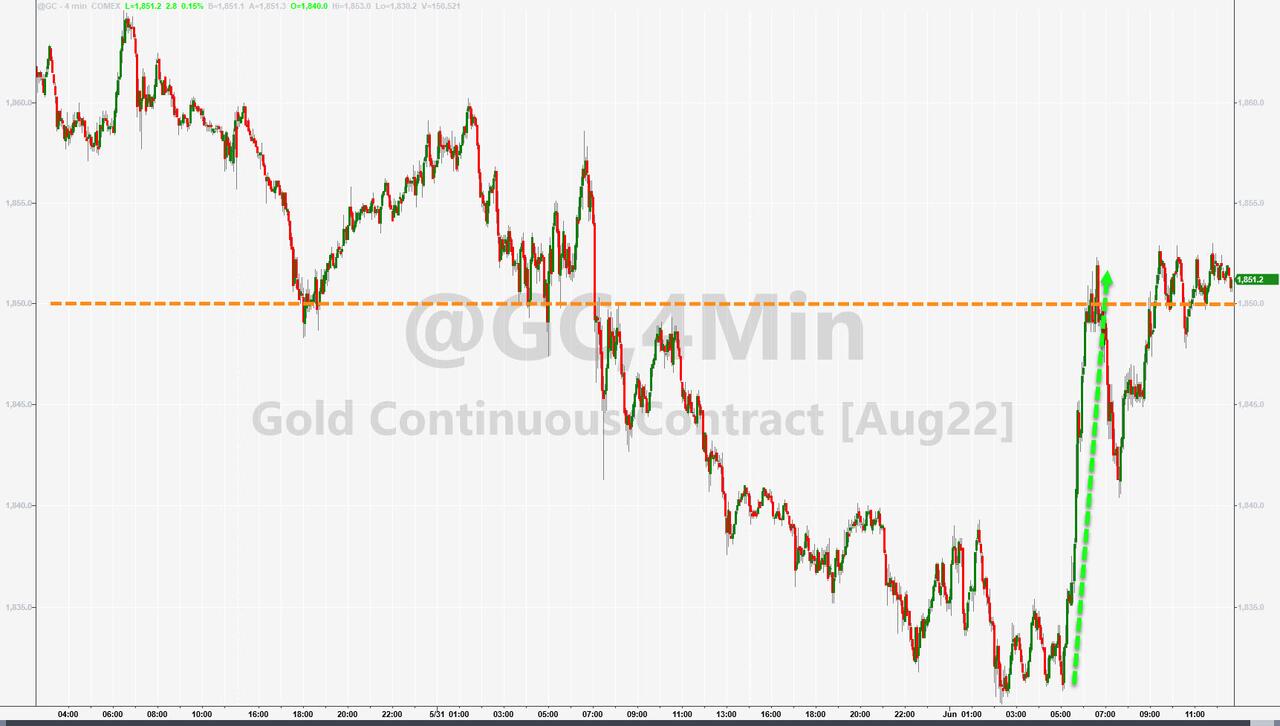
The mid-week short squeeze ran out of juice, Bond yields popped, the US Dollar advanced, while gold rode the rollercoaster this week and ended essentially unchanged.
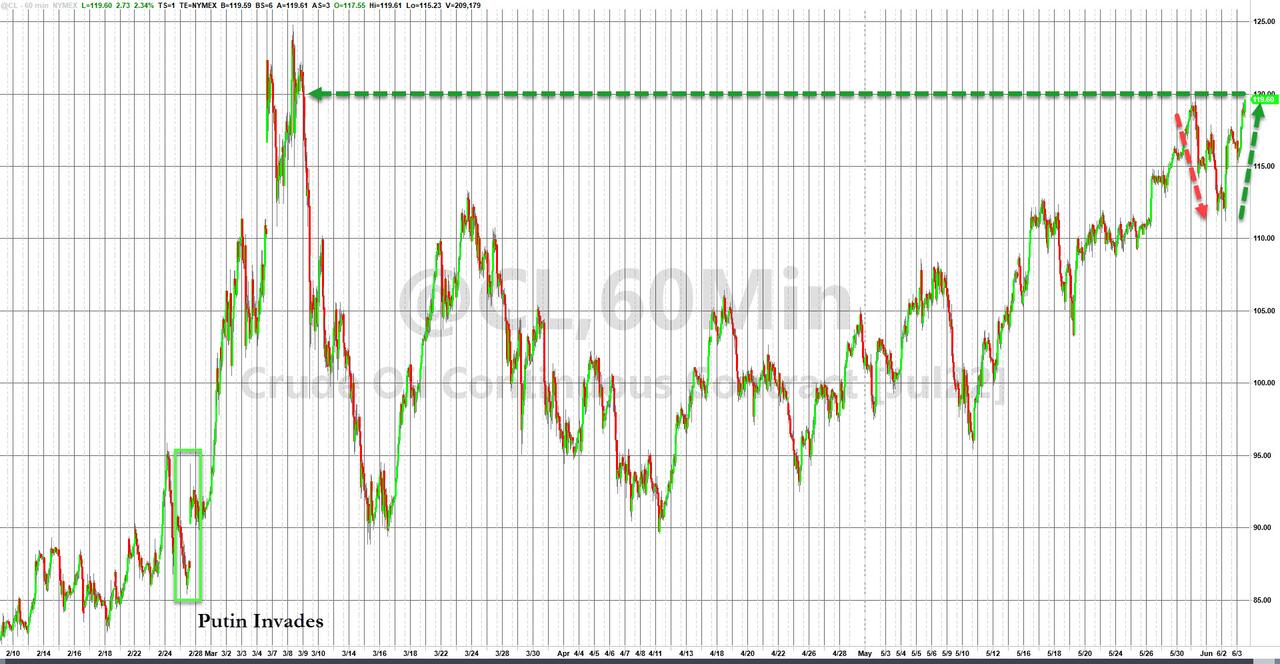
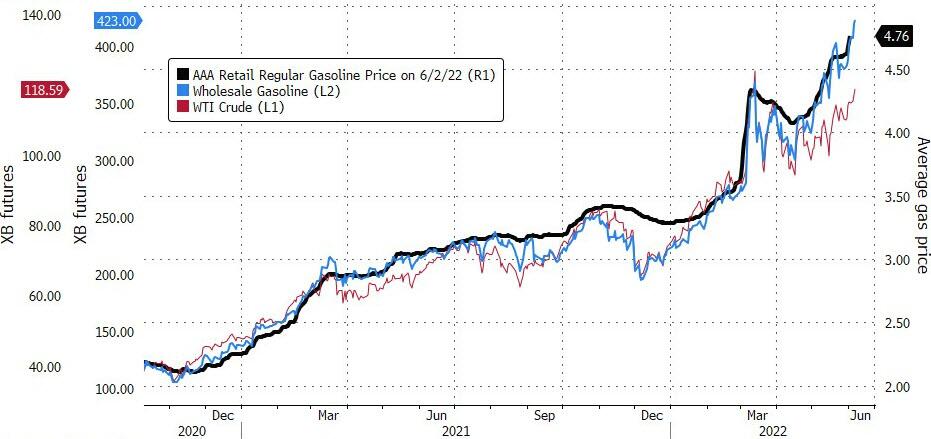
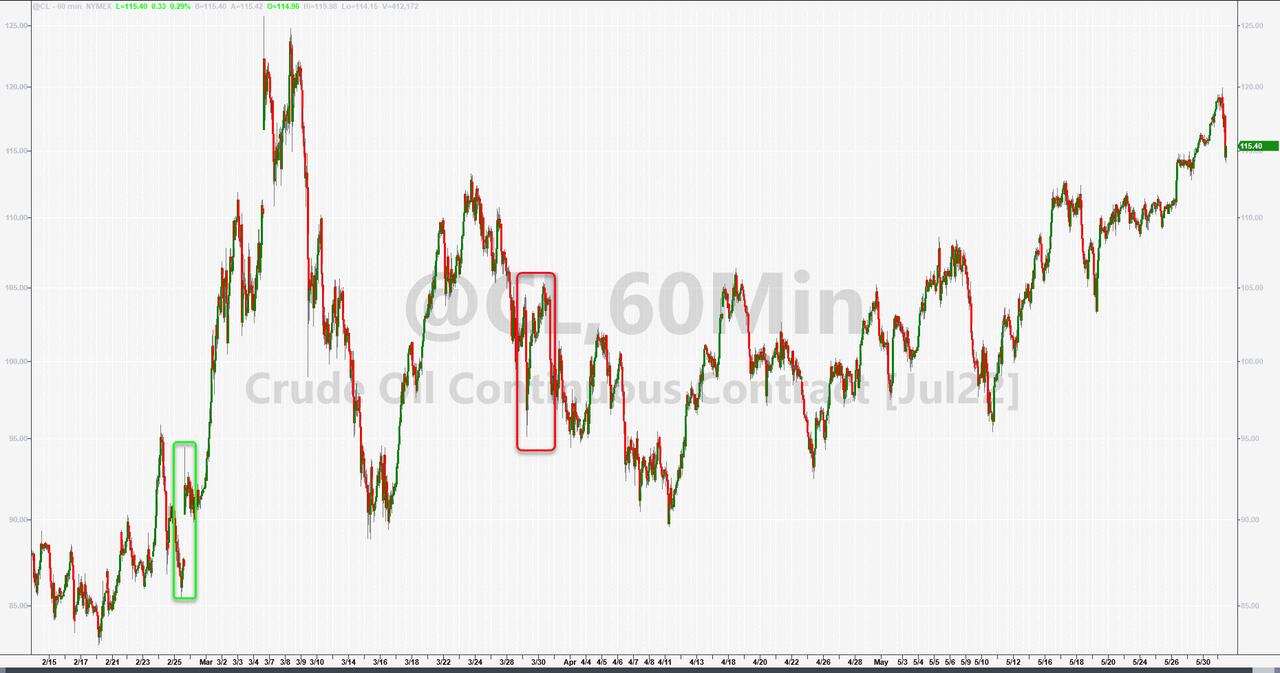
And, much to the current administration’s chagrin, Crude oil catapulted to $120, while gas prices continue their northerly trend without an end in sight.
1. From the universe of over 1,800 ETFs, I have selected only those with a trading volume of over $5 million per day (HV ETFs), so that liquidity and a small bid/ask spread are assured.
2. Trend Tracking Indexes (TTIs)
Buy or Sell decisions for Domestic and International ETFs (section 1 and 2), are made based on the respective TTI and its position either above or below its long-term M/A (Moving Average). A crossing of the trend line from below accompanied by some staying power above constitutes a “Buy” signal. Conversely, a clear break below the line constitutes a “Sell” signal. Additionally, I use an 12% trailing stop loss on all positions in these categories to control downside risk.
3. All other investment arenas do not have a TTI and should be traded based on the position of the individual ETF relative to its own respective trend line (%M/A). That’s why those signals are referred to as a “Selective Buy.” In other words, if an ETF crosses its own trendline to the upside, a “Buy” signal is generated. Here too, I recommend trailing sell stop of 12%, or less, depending on your risk tolerance.
If you are unfamiliar with some of the terminology, please see Glossary of Termsand new subscriber information in section 9.
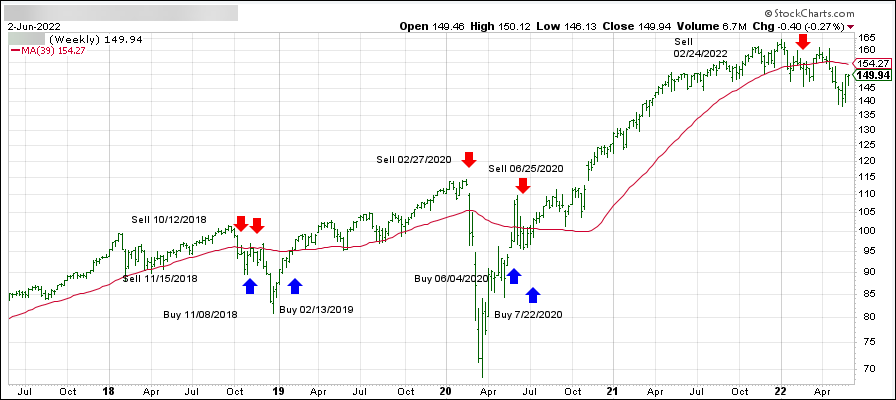
1. DOMESTIC EQUITY ETFs: SELL — since 02/24/2022
Click on chart to enlarge
Our main directional indicator, the Domestic Trend Tracking Index (TTI-green line in the above chart) has broken below its long-term trend line (red) by -2.89% and remains in “SELL” mode.
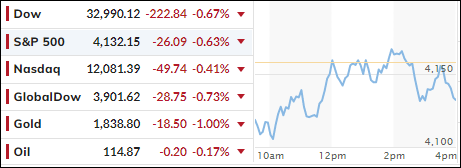
After an early bounce, the markets got double punched via a variety of headlines that gave the bears the upper hand and allowed them to dominate this session.
We learned that “inflation is sticky and degrowth is not slowing it,” as well as a warning by JP Morgan’s Jamie Dimon that “it’s a hurricane. That hurricane is right there, down the road, and coming our way. We don’t know if it’s a minor storm or if it’s a Superstorm Sandy,” all of which left last week’s dead-cat-bounce in the rearview mirror.
Not helping was the known fact that today was the first day of the Fed’s QT (Quantitative Tightening) program, which will affect markets negatively. As a result, the major indexes tumbled off their morning highs, while bond yields spiked and the US Dollar jumped.
An afternoon rebound effort failed with another dour outlook like “a soft-landing scenario is hard to achieve,” which was uttered by Wells Fargo’s CEO. Even the Fed’s Bostic clarified his previous comments that a “September pause” should in no way be interpreted as a “Fed Put.”
In the end, Rate-Hike Expectations rose, with stocks, bonds and banks all closing in the red. Gold bucked the trend and, despite an up and down ride, ended the day in the plus by a small margin.
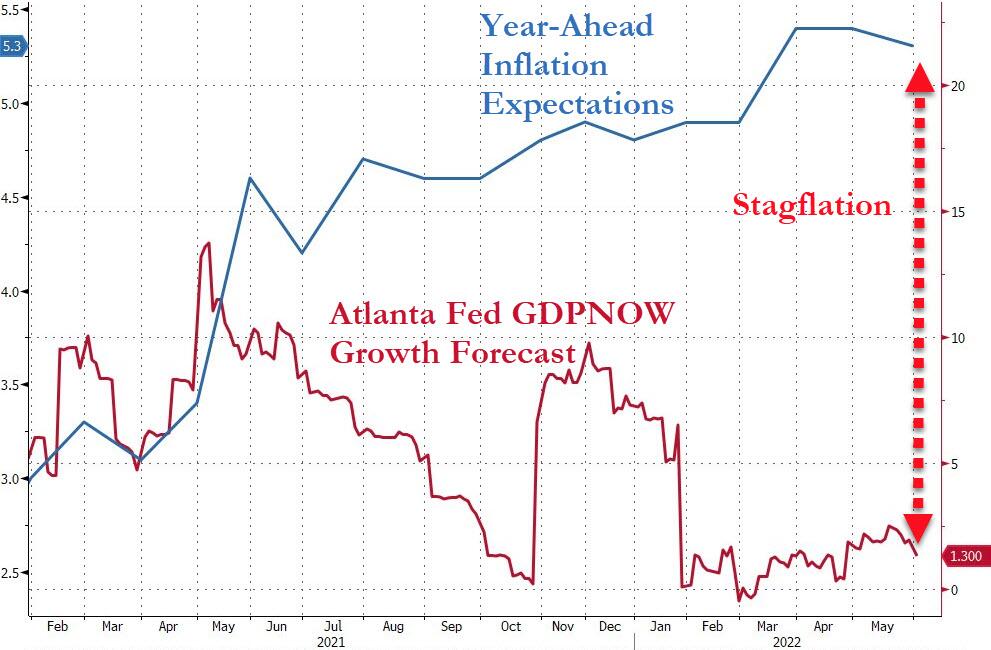
As ZH commented, the manufacturing surveys and the reduced Atlanta Fed’s own GDP forecast (revised down to +1.3%), as well as current inflation expectations, paint a picture that clearly screams “Stagflation.”
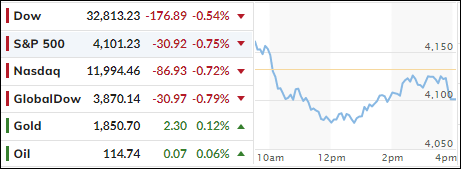
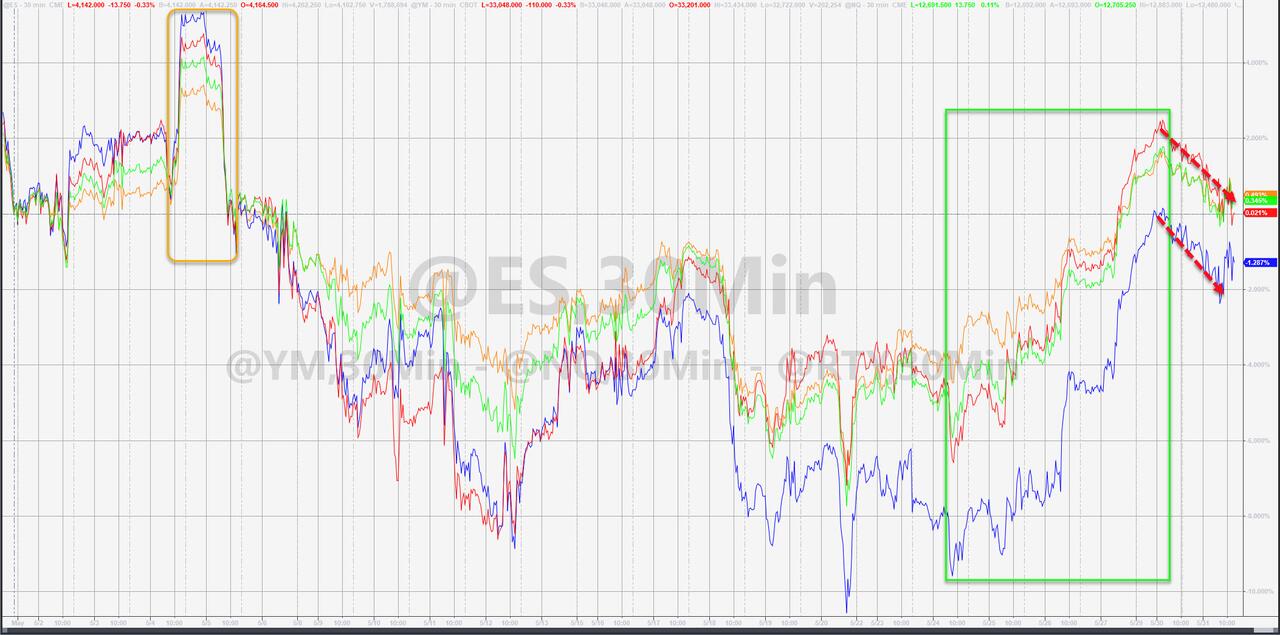
A roller-coaster month saw the S&P 500 dip into bear market territory (-20% from its recent high), before last week’s rebound rally pulled the index out of the doldrums. But that move ended today, with the major indexes simply running out of steam at the end of the session.
Inflation, monetary tightening and recession fears were at the center of the collapse, but a bear market rally, supported by a gigantic short-squeeze, assisted the S&P in its comeback to the breakeven point for the month.
Higher prices will be with us, as the markets took cues from the Eurozone, where inflation readings hit a record high for the seventh straight month by surging 8.1% in May. Crude oil prices contributed to today’s volatility and almost touched $120 intraday, before fading back to close at $115.
It was a “go nowhere fast” session, which ZH described like this:
30Y Bond unch-ish, S&P unch-ish, Gold unch-ish, Oil way-up, USD down, US Macro data total collapse…
The US Macro Data collapse, outside the April 2020 crash (where the government basically shut down the entire economy), May’s 2022 fall was the worst since October 2008, when all capital markets froze up.
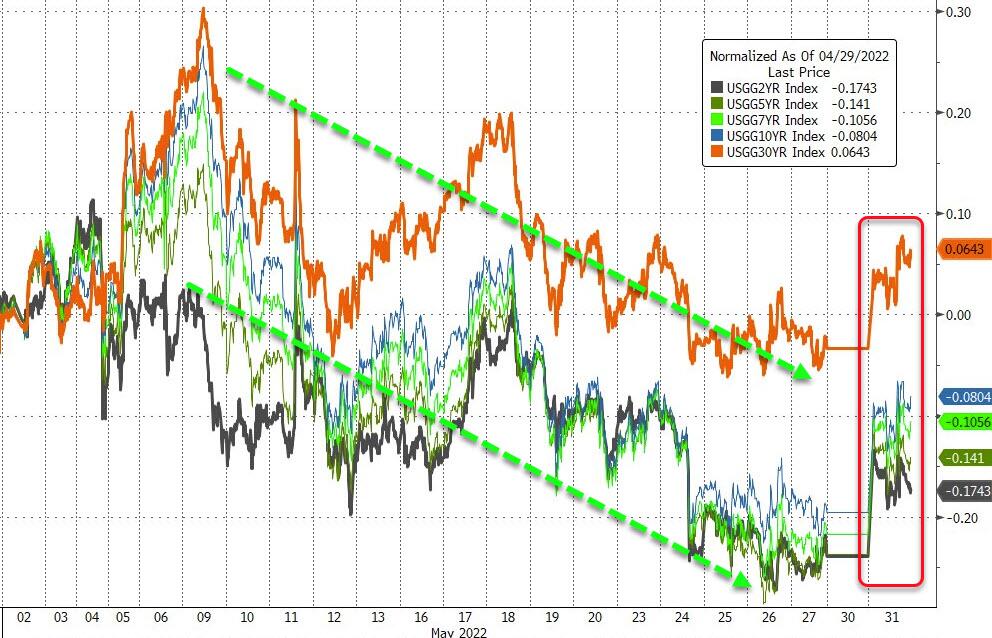
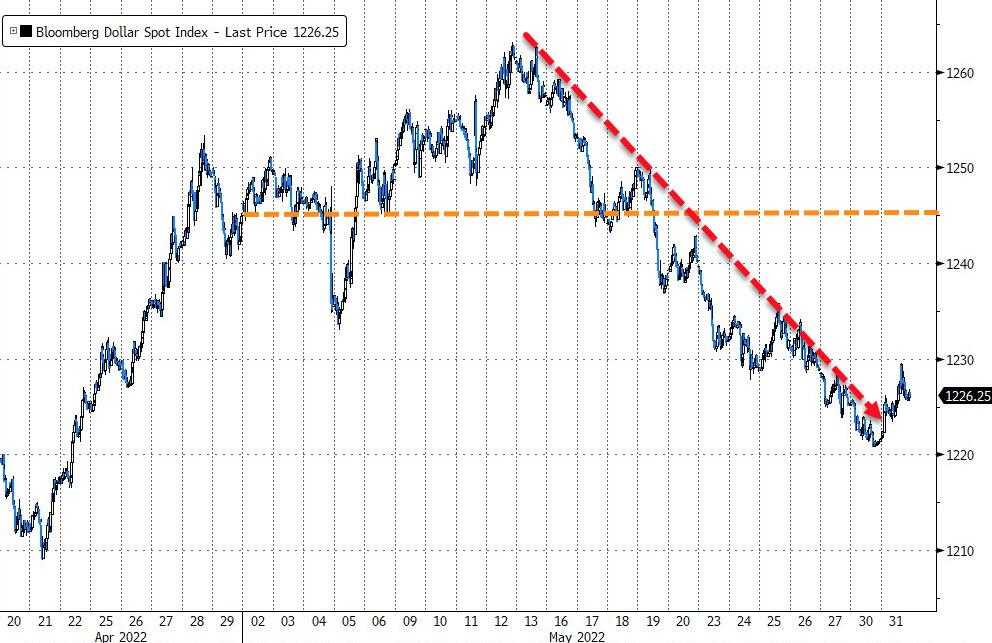
Bond yields were lower during May, as this chart by Bloomberg shows, but today’s turnaround may signal higher yields on deck again. The US Dollar slumped and saw its worst month in 2 years. Gold was down moderately for May and continues to struggle around its $1,900 level.
Below, please find the latest High-Volume ETF Cutline report, which shows how far above or below their respective long-term trend lines (39-week SMA) my currently tracked ETFs are positioned.
This report covers the HV ETF Master List from Thursday’s StatSheet and includes 312 High Volume ETFs, defined as those with an average daily volume of more than $5 million, of which currently 69 (last week 45) are hovering in bullish territory. The yellow line separates those ETFs that are positioned above their trend line (%M/A) from those that have dropped below it.
In case you are not familiar with some of the terminology used in the reports, please read the Glossary of Terms. If you missed the original post about the Cutline approach, you can read it here.