
- Moving the markets
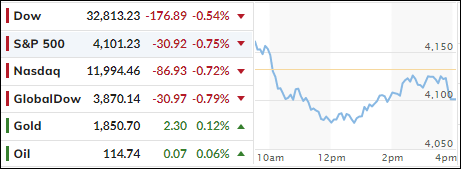
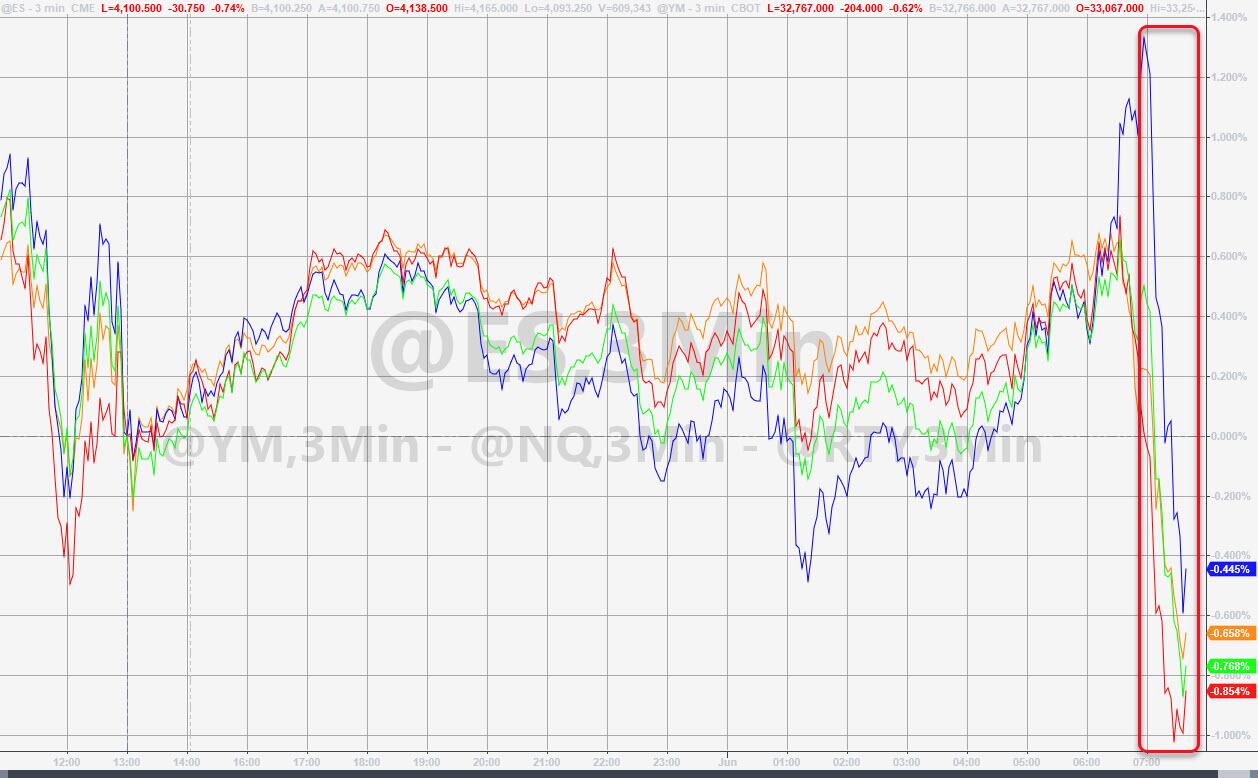
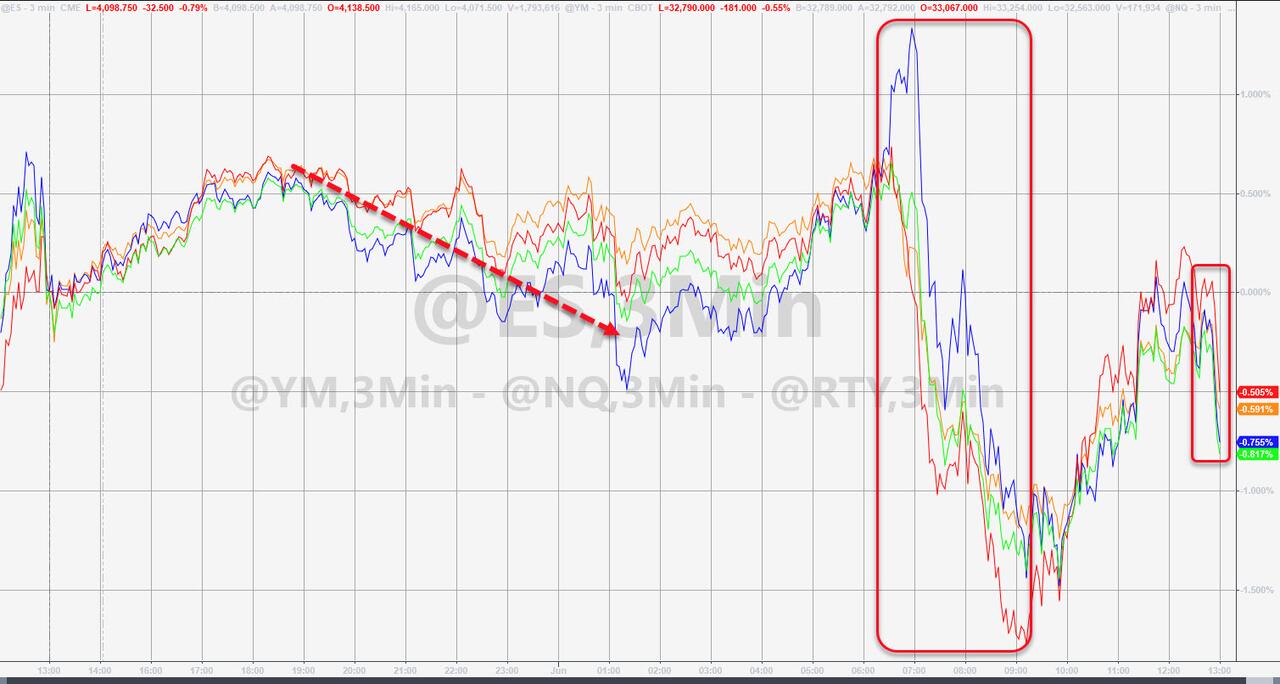
After an early bounce, the markets got double punched via a variety of headlines that gave the bears the upper hand and allowed them to dominate this session.
We learned that “inflation is sticky and degrowth is not slowing it,” as well as a warning by JP Morgan’s Jamie Dimon that “it’s a hurricane. That hurricane is right there, down the road, and coming our way. We don’t know if it’s a minor storm or if it’s a Superstorm Sandy,” all of which left last week’s dead-cat-bounce in the rearview mirror.
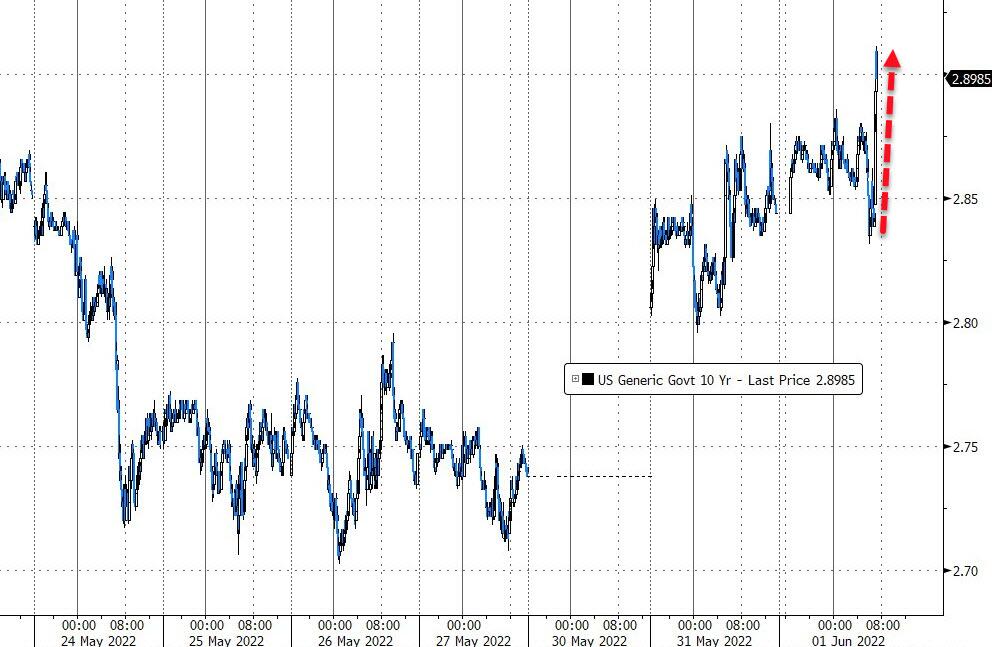
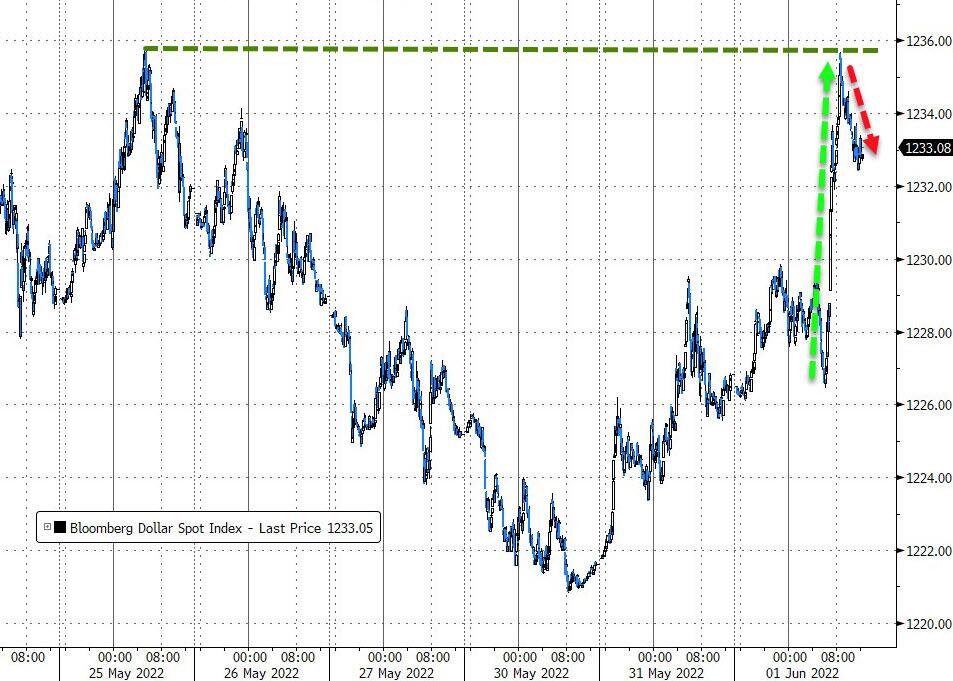
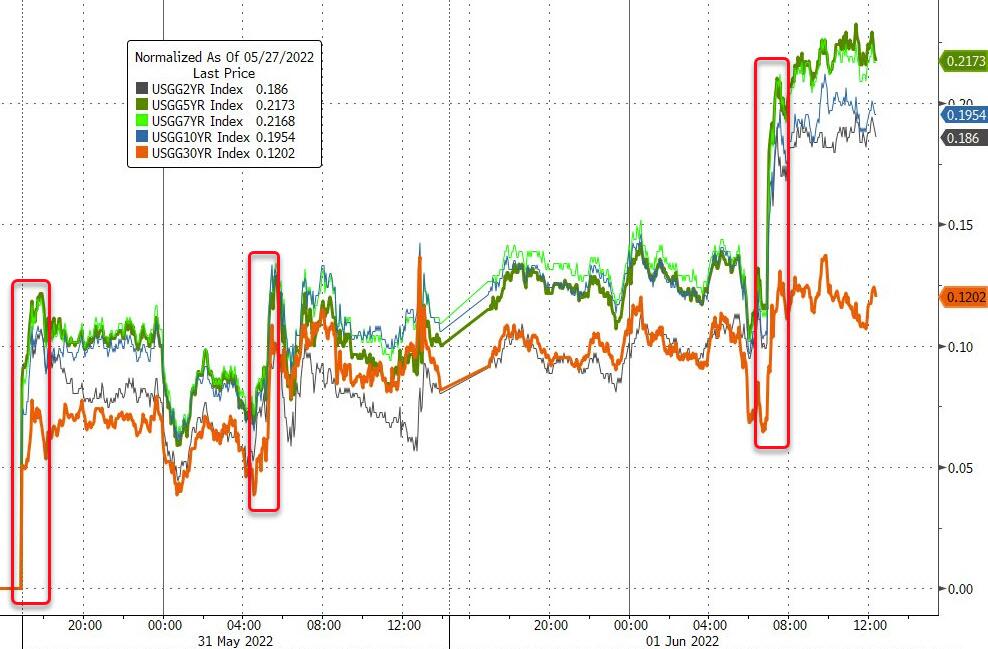
Not helping was the known fact that today was the first day of the Fed’s QT (Quantitative Tightening) program, which will affect markets negatively. As a result, the major indexes tumbled off their morning highs, while bond yields spiked and the US Dollar jumped.
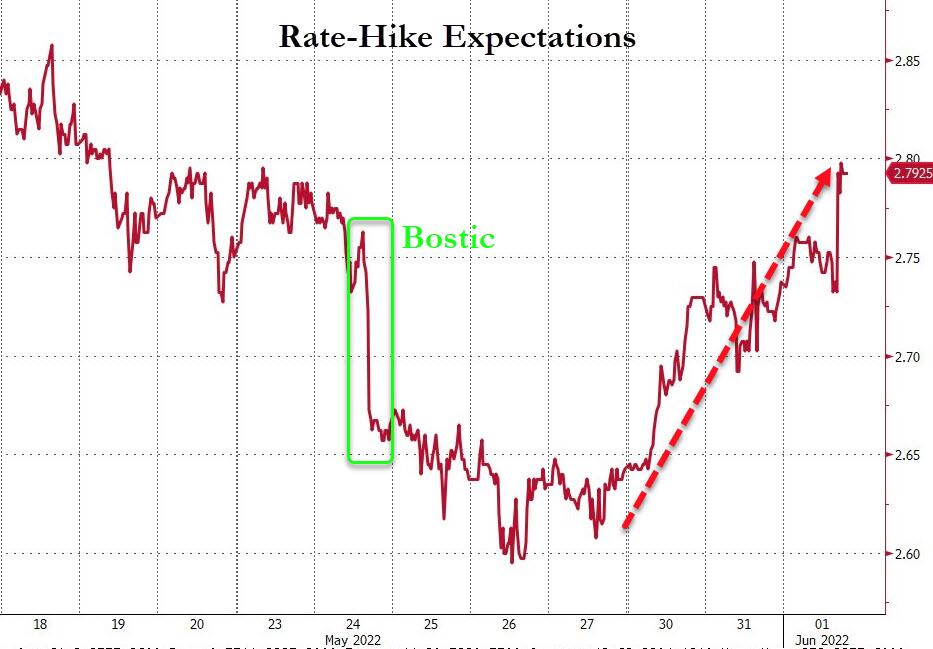
An afternoon rebound effort failed with another dour outlook like “a soft-landing scenario is hard to achieve,” which was uttered by Wells Fargo’s CEO. Even the Fed’s Bostic clarified his previous comments that a “September pause” should in no way be interpreted as a “Fed Put.”
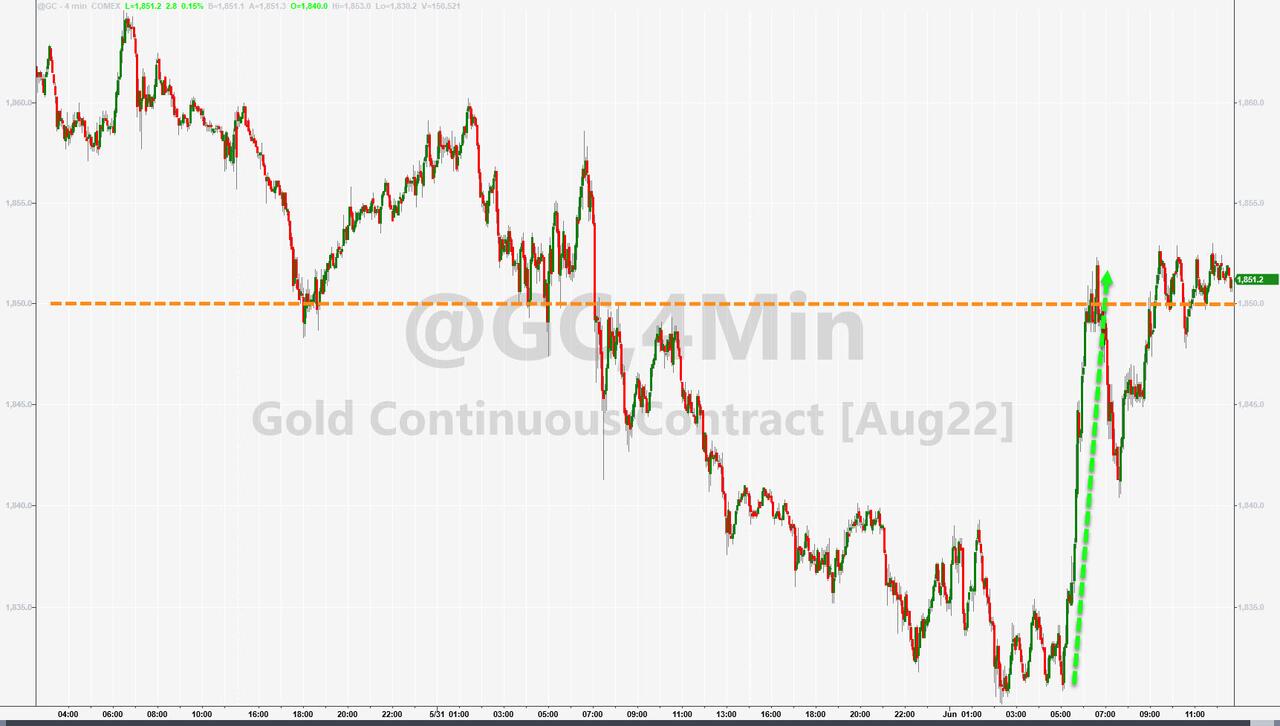
In the end, Rate-Hike Expectations rose, with stocks, bonds and banks all closing in the red. Gold bucked the trend and, despite an up and down ride, ended the day in the plus by a small margin.
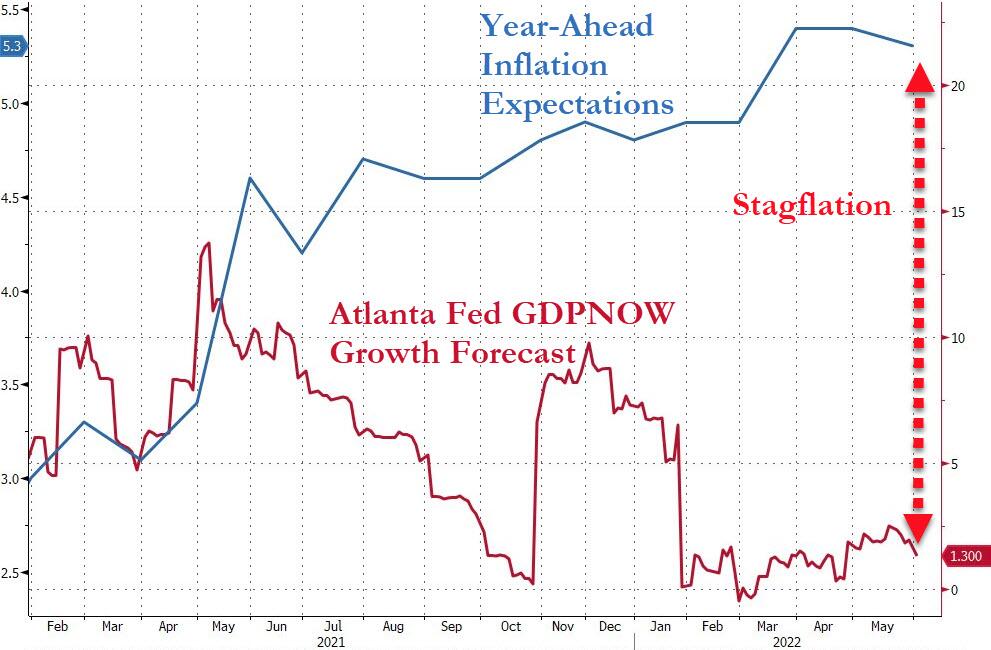
As ZH commented, the manufacturing surveys and the reduced Atlanta Fed’s own GDP forecast (revised down to +1.3%), as well as current inflation expectations, paint a picture that clearly screams “Stagflation.”
2. ETFs in the Spotlight
In case you missed the announcement and description of this section, you can read it here again.
It features some of the 10 broadly diversified domestic and sector ETFs from my HighVolume list as posted every Saturday. Furthermore, they are screened for the lowest MaxDD% number meaning they have been showing better resistance to temporary sell offs than all others over the past year.
The below table simply demonstrates the magnitude with which these ETFs are fluctuating above or below their respective individual trend lines (%+/-M/A). A break below, represented by a negative number, shows weakness, while a break above, represented by a positive percentage, shows strength.
For hundreds of ETF choices, be sure to reference Thursday’s StatSheet.
For this closed-out domestic “Buy” cycle (2/24/2022), here’s how some of our candidates have fared:
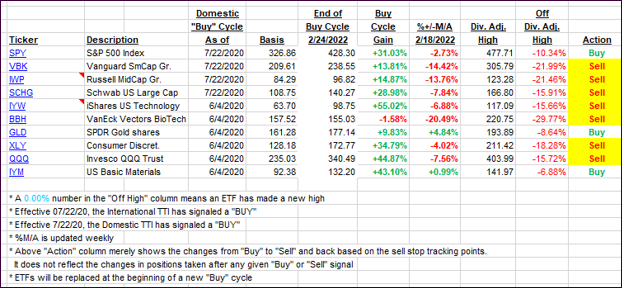
Click image to enlarge.
Again, the %+/-M/A column above shows the position of the various ETFs in relation to their respective long-term trend lines, while the trailing sell stops are being tracked in the “Off High” column. The “Action” column will signal a “Sell” once the -12% point has been taken out in the “Off High” column, which has replaced the prior -8% to -10% limits.
3. Trend Tracking Indexes (TTIs)
Our TTIs dropped as the bears dominated today’s market.
This is how we closed 06/01/2022:
Domestic TTI: -4.57% below its M/A (prior close -3.54%)—Sell signal effective 02/24/2022.
International TTI: -4.16% below its M/A (prior close -3.39%)—Sell signal effective 03/08/2022.
Disclosure: I am obliged to inform you that I, as well as my advisory clients, own some of the ETFs listed in the above table. Furthermore, they do not represent a specific investment recommendation for you, they merely show which ETFs from the universe I track are falling within the specified guidelines.
All linked charts above are courtesy of Bloomberg via ZeroHedge.
Contact Ulli