
ETF Tracker StatSheet
You can view the latest version here.
KILLING THE DEAD-CAT BOUNCE
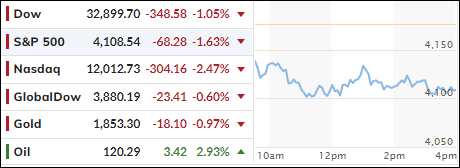
[Chart courtesy of MarketWatch.com]
- Moving the markets
Sometimes you simply must shake your head and laugh out loud. Yesterday’s rally, AKA another dead-cat-bounce, was such an occasion, as headline news were peppered with bearish announcements such as “plunging productivity,” an “ugly ADP announcement,” followed by “disappointing factory orders” and “hawkish Fed talk.”
As a result, we witnessed another occurrence of “bad news is good news,” with the markets staging a Ramp-A-Thon, which sent the Dow up some 435 points.
Fast forward to today, when reality set in, as yesterday’s bull fest turned into another head fake that forced the major indexes to the mat and not too far from where we started the day before.
Payrolls came in hotter than expected with the US adding 390k jobs in May, which was at a 13-month low, but it beat expectations of 320k. The numbers for March were revised downward from 428k to 398k, while April’s were revised upward from 428k to 436k.
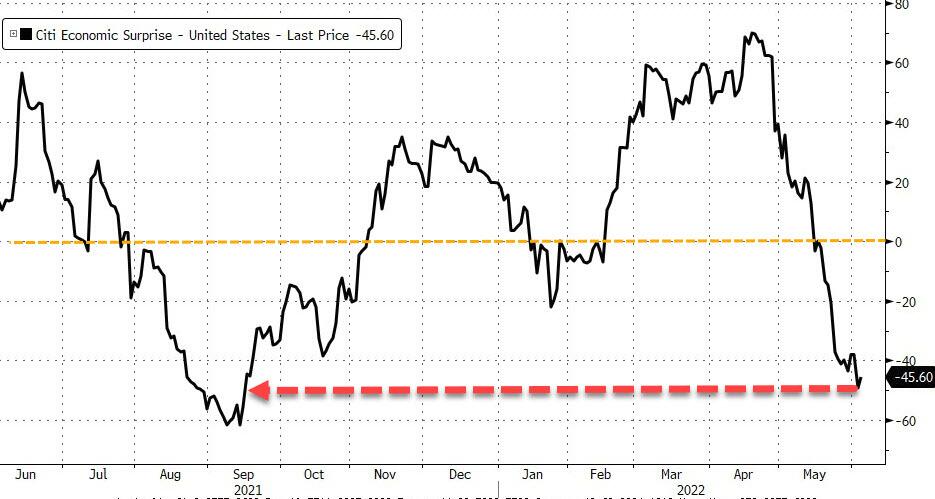
The state of the economy, as demonstrated via the Citi Surprise Index, clearly shows to be in crash mode, a condition that was not lost on Tesla’s Elon Musk, who said that he has a “super bad feeling about the economy,” and tweeted that “recessions serve a vital economic cleansing function,” the latter of which you will hear never being discussed on MSM.
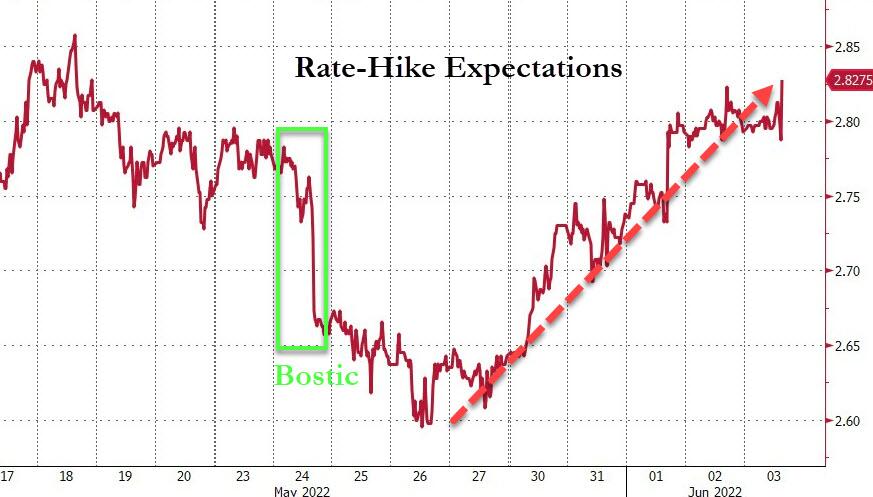
A couple of bigwigs chimed in with Elon Musk’s assessment, which helped to punish equities. First, JPM’s Jamie Dimon downshifted his economic outlook from “clouds on the horizon” to “an imminent hurricane,” while Goldman’s President John Waldron added that “the shocks to the system are unprecedented,” as ZeroHedge reported.
As a result, Rate Hike Expectations rose again, because the Fed’s rhetoric put the potential of higher rates and a non-pause in September back in traders’ minds.
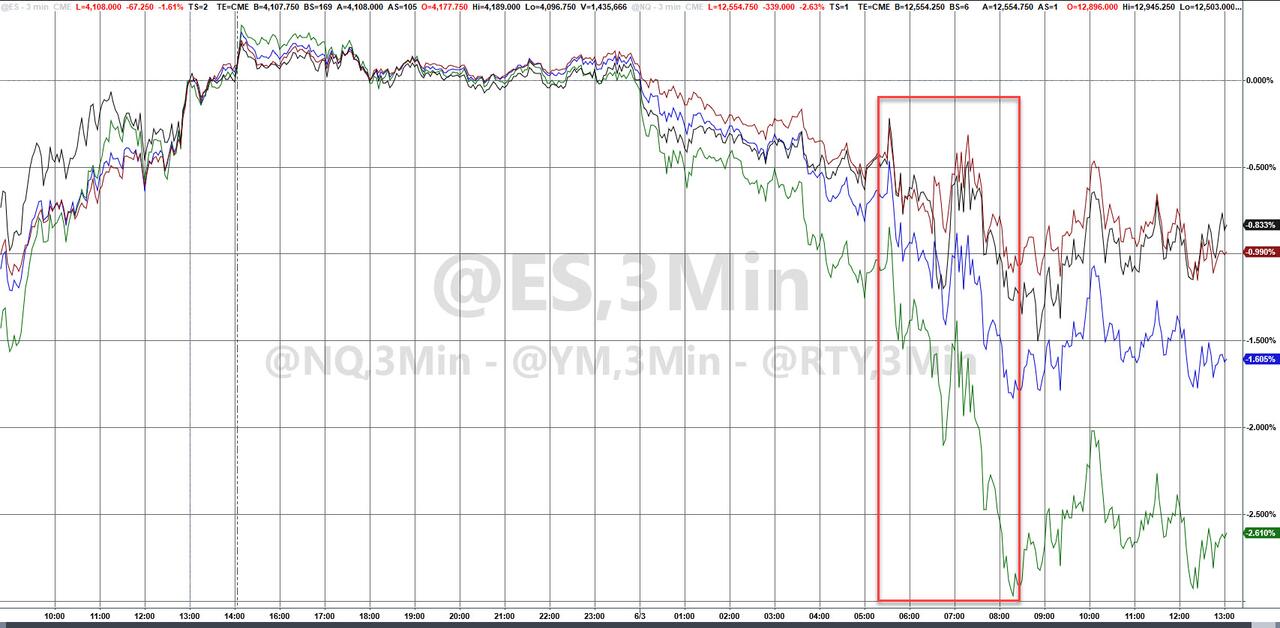
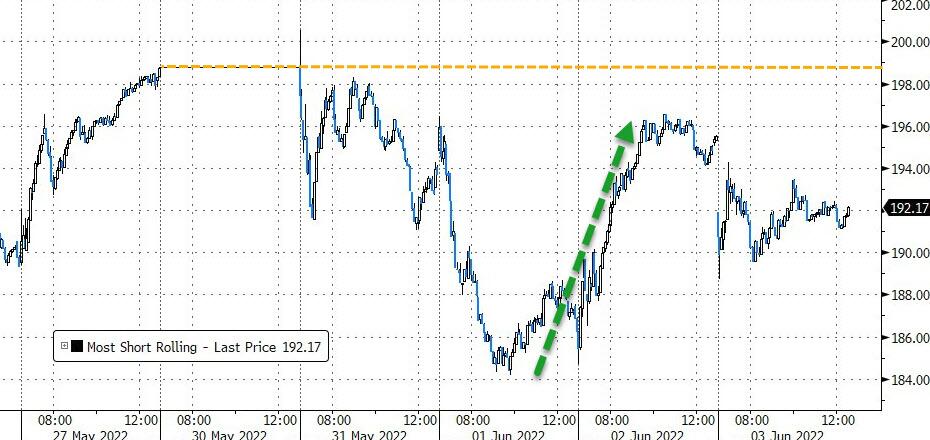
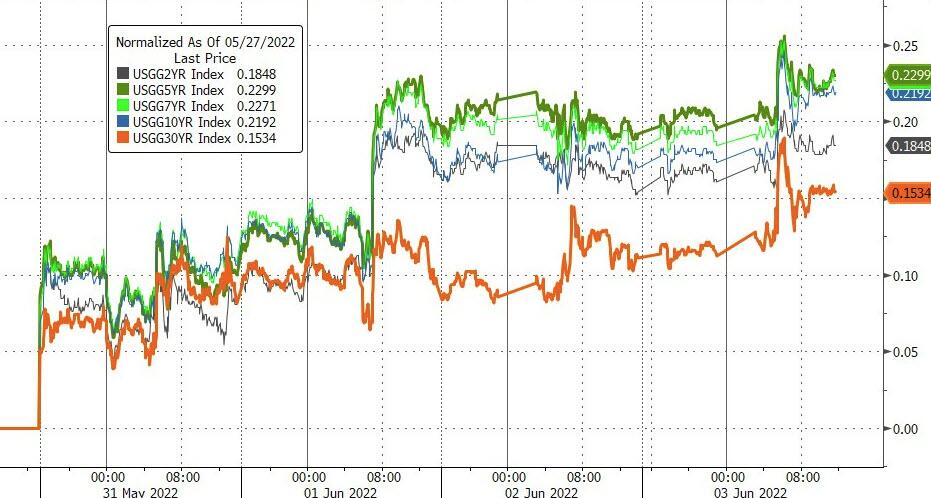
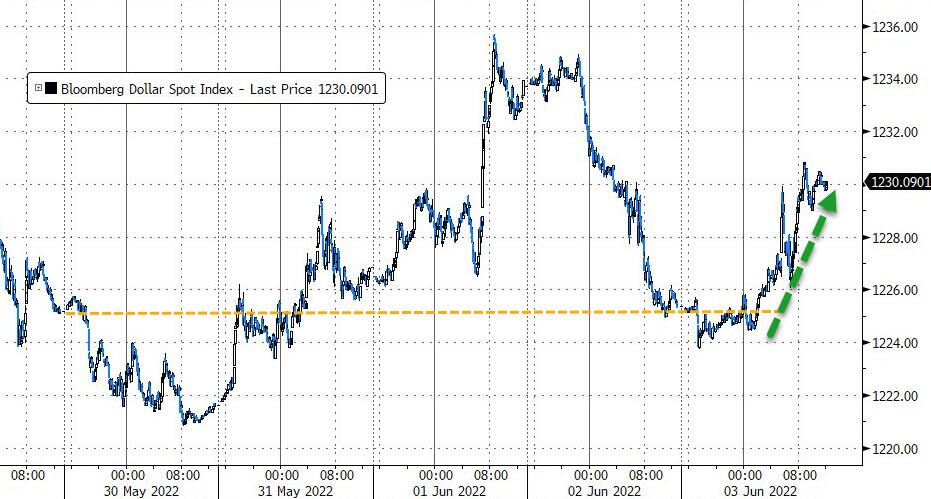
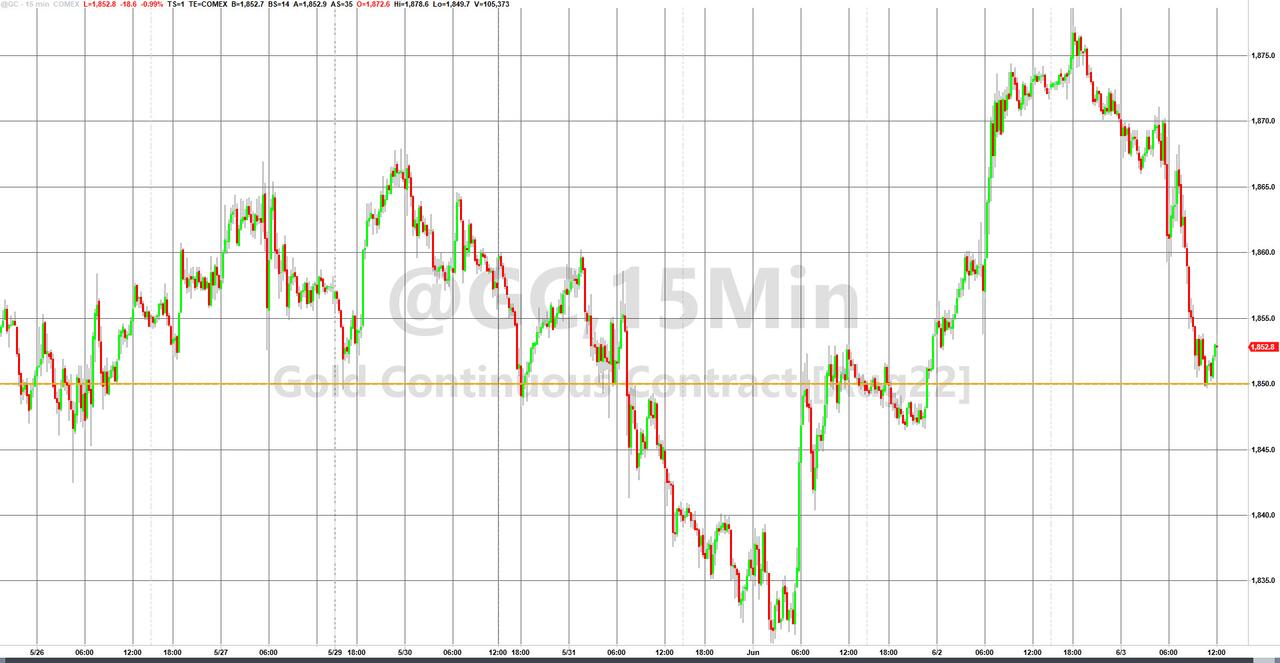
The mid-week short squeeze ran out of juice, Bond yields popped, the US Dollar advanced, while gold rode the rollercoaster this week and ended essentially unchanged.
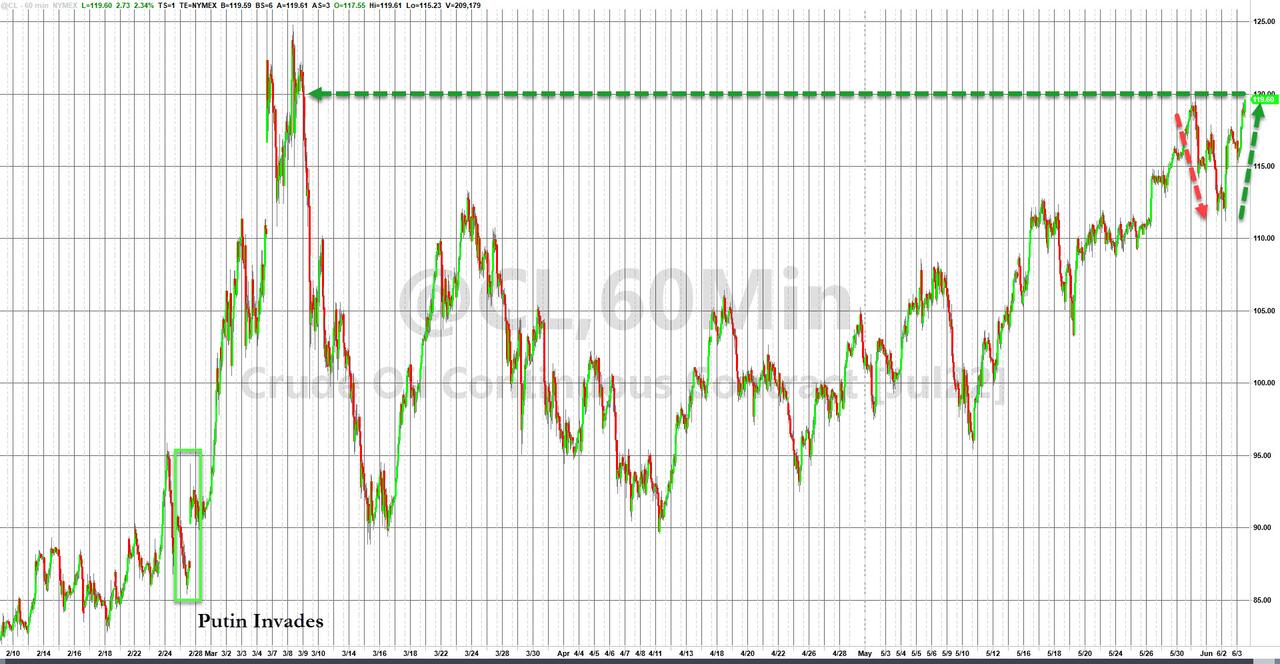
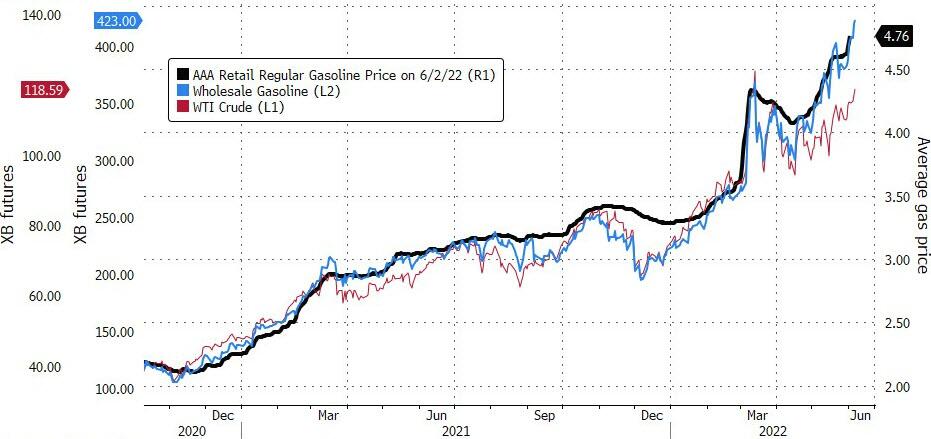
And, much to the current administration’s chagrin, Crude oil catapulted to $120, while gas prices continue their northerly trend without an end in sight.
2. ETFs in the Spotlight
In case you missed the announcement and description of this section, you can read it here again.
It features some of the 10 broadly diversified domestic and sector ETFs from my HighVolume list as posted every Saturday. Furthermore, they are screened for the lowest MaxDD% number meaning they have been showing better resistance to temporary sell offs than all others over the past year.
The below table simply demonstrates the magnitude with which these ETFs are fluctuating above or below their respective individual trend lines (%+/-M/A). A break below, represented by a negative number, shows weakness, while a break above, represented by a positive percentage, shows strength.
For hundreds of ETF choices, be sure to reference Thursday’s StatSheet.
For this closed-out domestic “Buy” cycle (2/24/2022), here’s how some of our candidates have fared:
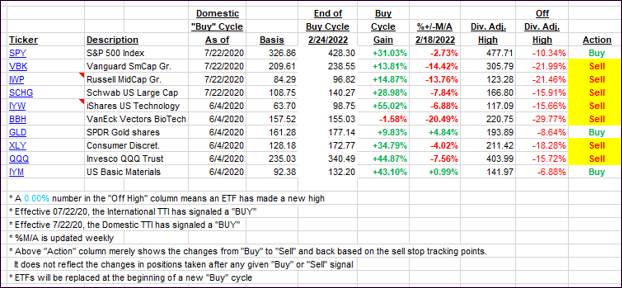
Click image to enlarge.
Again, the %+/-M/A column above shows the position of the various ETFs in relation to their respective long-term trend lines, while the trailing sell stops are being tracked in the “Off High” column. The “Action” column will signal a “Sell” once the -12% point has been taken out in the “Off High” column, which has replaced the prior -8% to -10% limits.
3. Trend Tracking Indexes (TTIs)
Our TTIs slipped with the bears clearly being in charge of today’s session.
This is how we closed 06/03/2022:
Domestic TTI: -3.92% below its M/A (prior close -2.89%)—Sell signal effective 02/24/2022.
International TTI: -3.80% below its M/A (prior close -3.25%)—Sell signal effective 03/08/2022.
Disclosure: I am obliged to inform you that I, as well as my advisory clients, own some of the ETFs listed in the above table. Furthermore, they do not represent a specific investment recommendation for you, they merely show which ETFs from the universe I track are falling within the specified guidelines.
All linked charts above are courtesy of Bloomberg via ZeroHedge.
———————————————————-
WOULD YOU LIKE TO HAVE YOUR INVESTMENTS PROFESSIONALLY MANAGED?
Do you have the time to follow our investment plans yourself? If you are a busy professional who would like to have his portfolio managed using our methodology, please contact me directly or get more details.
Contact Ulli