
- Moving the markets
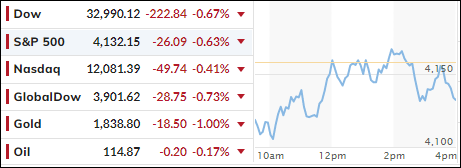
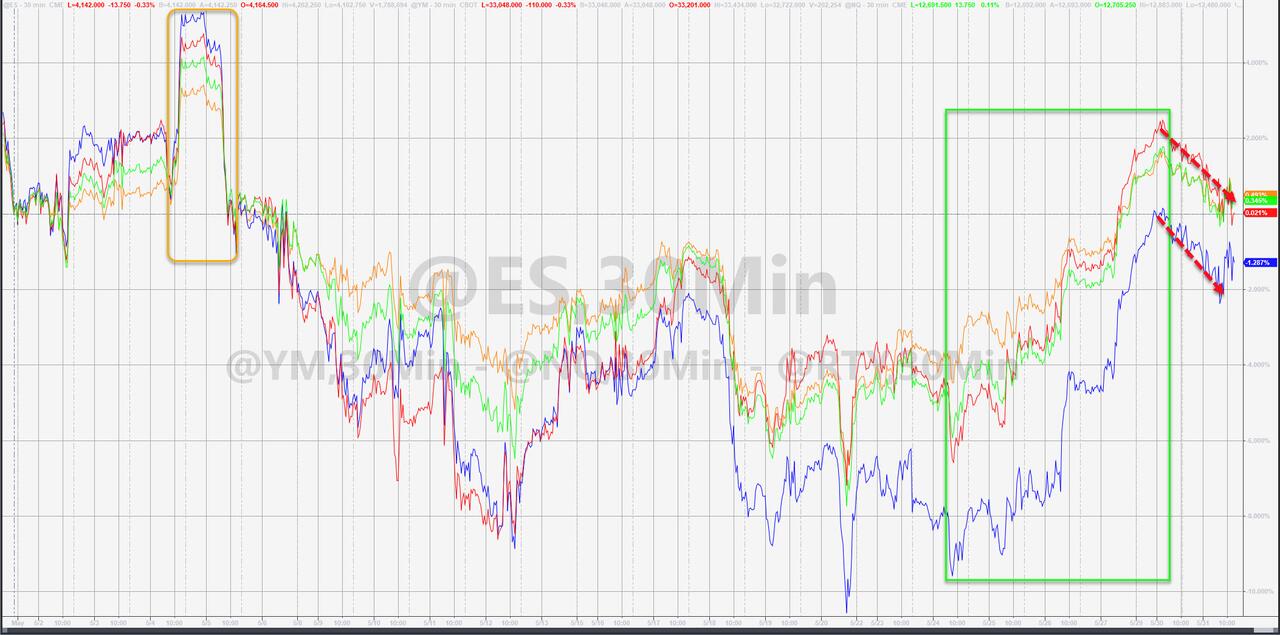
A roller-coaster month saw the S&P 500 dip into bear market territory (-20% from its recent high), before last week’s rebound rally pulled the index out of the doldrums. But that move ended today, with the major indexes simply running out of steam at the end of the session.
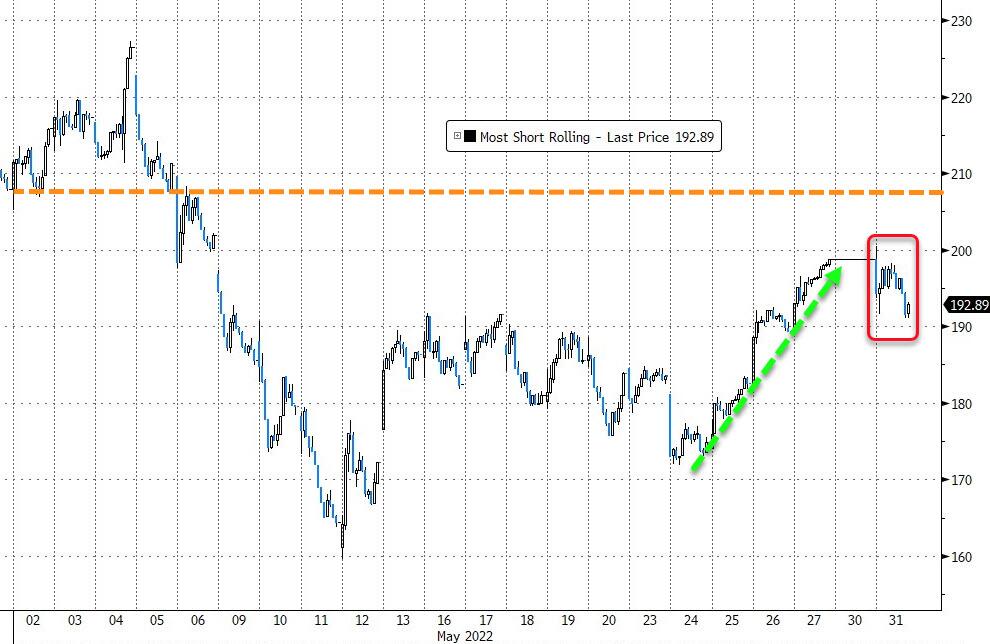
Inflation, monetary tightening and recession fears were at the center of the collapse, but a bear market rally, supported by a gigantic short-squeeze, assisted the S&P in its comeback to the breakeven point for the month.
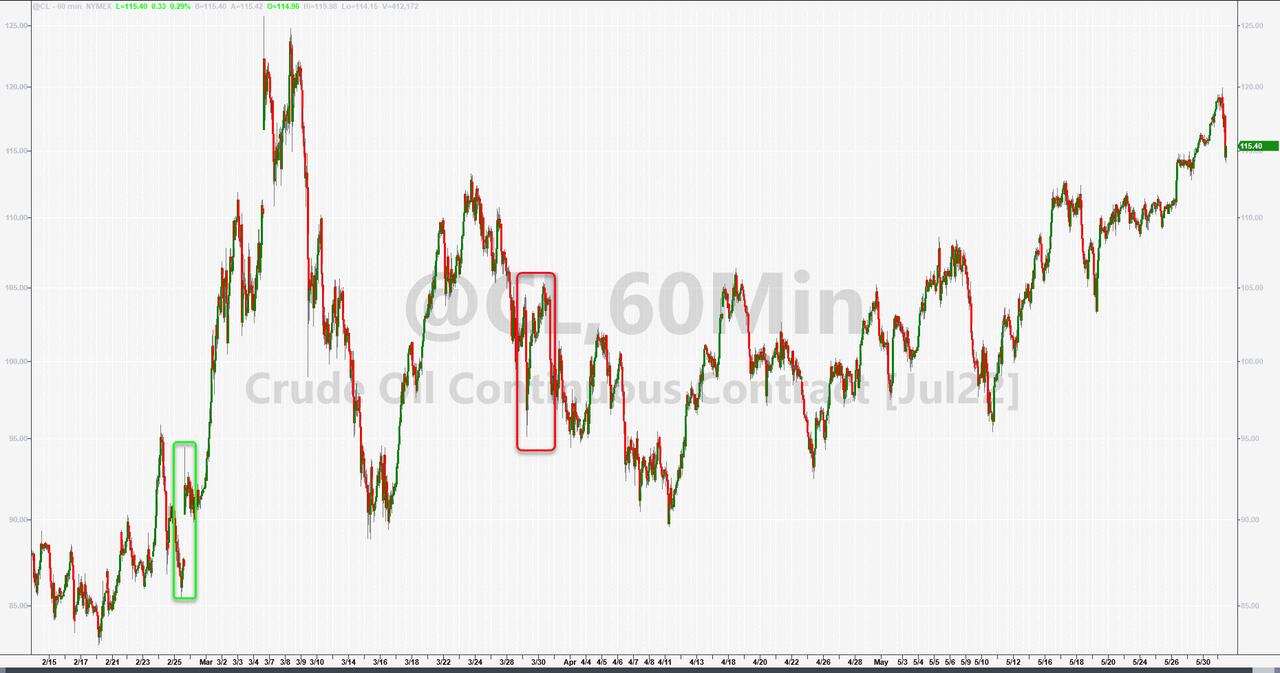
Higher prices will be with us, as the markets took cues from the Eurozone, where inflation readings hit a record high for the seventh straight month by surging 8.1% in May. Crude oil prices contributed to today’s volatility and almost touched $120 intraday, before fading back to close at $115.
It was a “go nowhere fast” session, which ZH described like this:
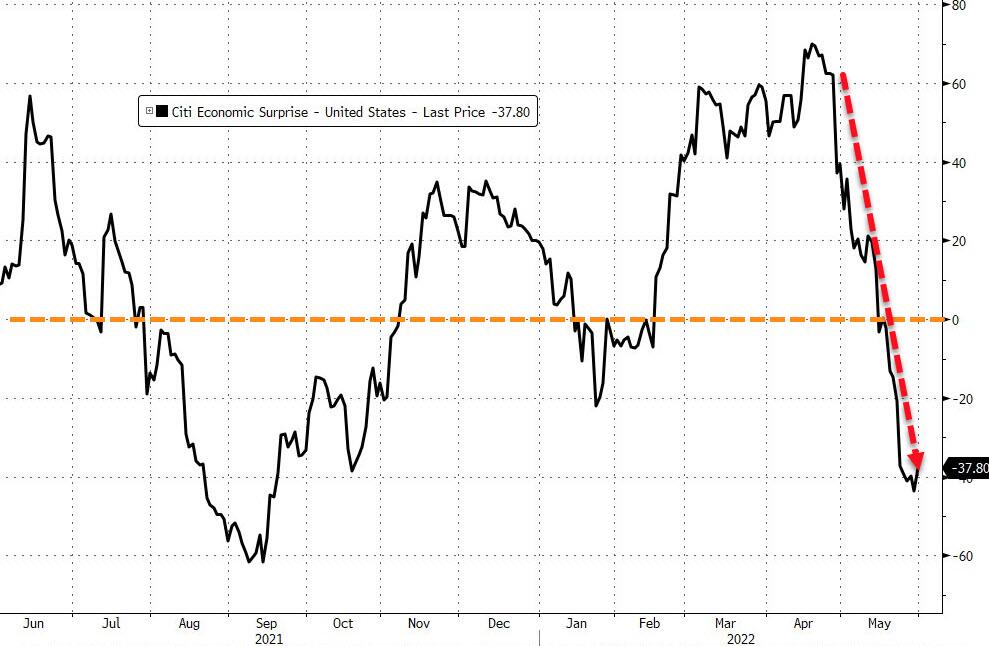
30Y Bond unch-ish, S&P unch-ish, Gold unch-ish, Oil way-up, USD down, US Macro data total collapse…
The US Macro Data collapse, outside the April 2020 crash (where the government basically shut down the entire economy), May’s 2022 fall was the worst since October 2008, when all capital markets froze up.
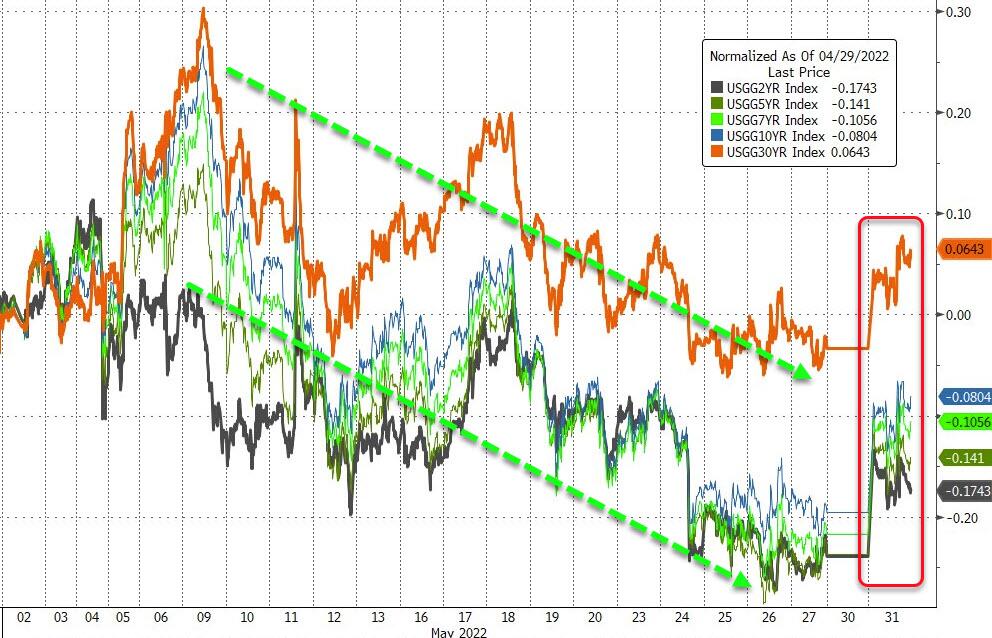
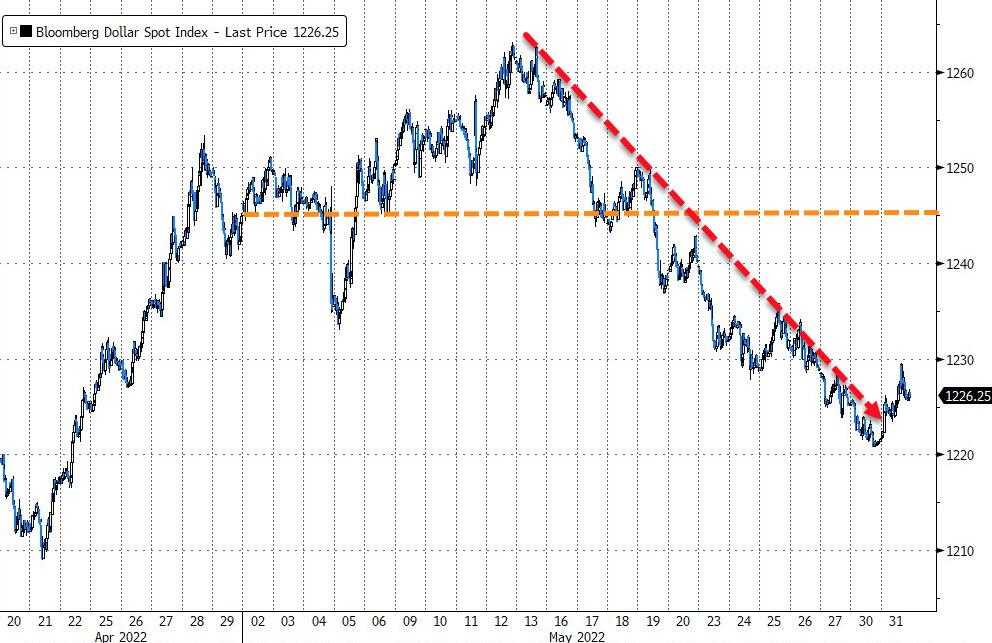
Bond yields were lower during May, as this chart by Bloomberg shows, but today’s turnaround may signal higher yields on deck again. The US Dollar slumped and saw its worst month in 2 years. Gold was down moderately for May and continues to struggle around its $1,900 level.
2. ETFs in the Spotlight
In case you missed the announcement and description of this section, you can read it here again.
It features some of the 10 broadly diversified domestic and sector ETFs from my HighVolume list as posted every Saturday. Furthermore, they are screened for the lowest MaxDD% number meaning they have been showing better resistance to temporary sell offs than all others over the past year.
The below table simply demonstrates the magnitude with which these ETFs are fluctuating above or below their respective individual trend lines (%+/-M/A). A break below, represented by a negative number, shows weakness, while a break above, represented by a positive percentage, shows strength.
For hundreds of ETF choices, be sure to reference Thursday’s StatSheet.
For this closed-out domestic “Buy” cycle (2/24/2022), here’s how some of our candidates have fared:
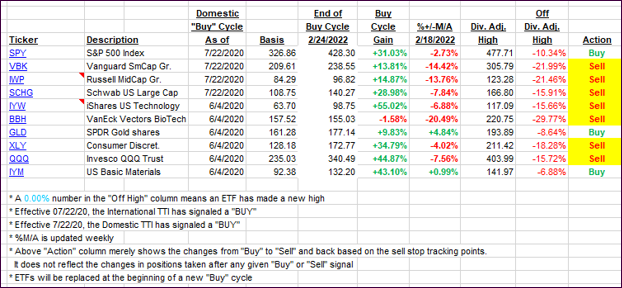
Click image to enlarge.
Again, the %+/-M/A column above shows the position of the various ETFs in relation to their respective long-term trend lines, while the trailing sell stops are being tracked in the “Off High” column. The “Action” column will signal a “Sell” once the -12% point has been taken out in the “Off High” column, which has replaced the prior -8% to -10% limits.
3. Trend Tracking Indexes (TTIs)
Our TTIs lost steam as well and dipped deeper into bearish territory.
This is how we closed 05/31/2022:
Domestic TTI: -3.54% below its M/A (prior close -2.63%)—Sell signal effective 02/24/2022.
International TTI: -3.39% below its M/A (prior close -3.11%)—Sell signal effective 03/08/2022.
Disclosure: I am obliged to inform you that I, as well as my advisory clients, own some of the ETFs listed in the above table. Furthermore, they do not represent a specific investment recommendation for you, they merely show which ETFs from the universe I track are falling within the specified guidelines.
All linked charts above are courtesy of Bloomberg via ZeroHedge.
Contact Ulli