
ETF Tracker StatSheet
You can view the latest version here.
LATEST CPI READING PUMMELS STOCKS
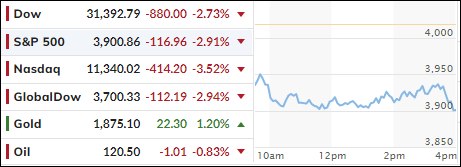
[Chart courtesy of MarketWatch.com]
- Moving the markets
After yesterday’s spanking, which left the major indexes in the red by some +2%, with the Dow dumping over 600 points, today’s session presented another rude awakening thanks to a worse than expected CPI reading.
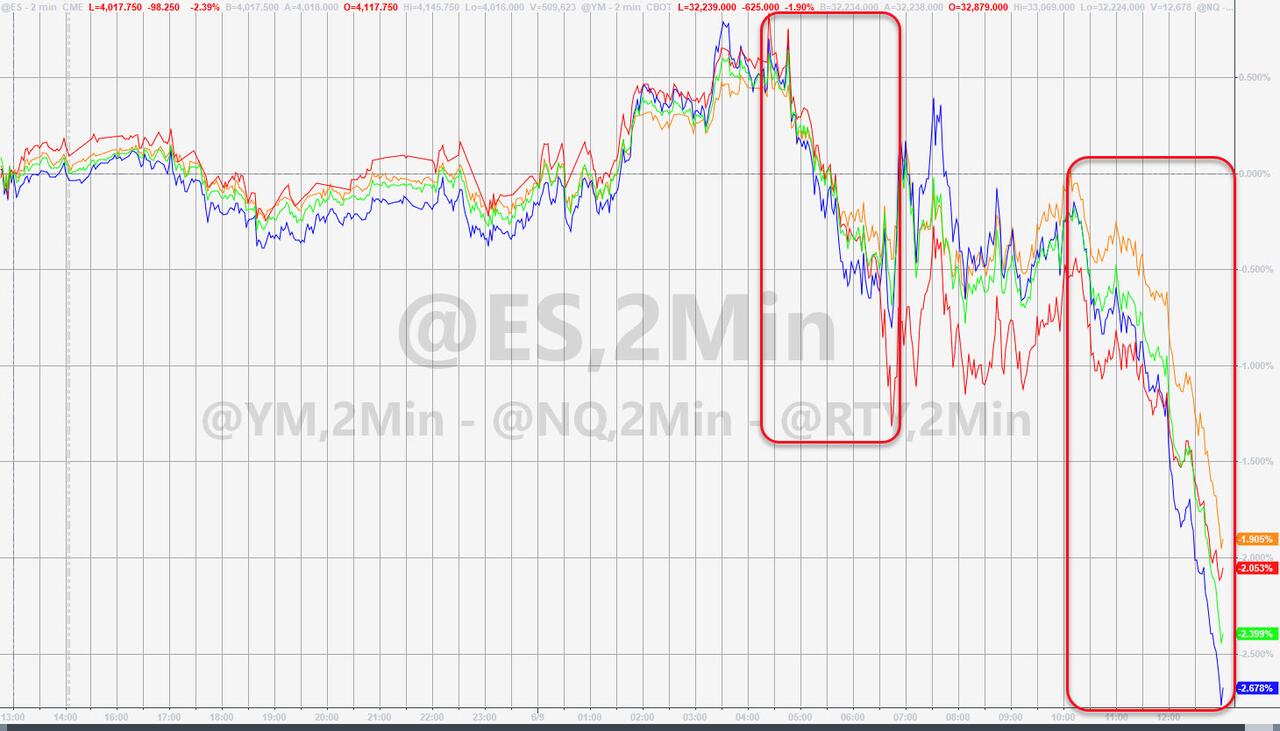
The Dow dove 880 points when traders realized that inflation had not peaked yet, as had been falsely assumed, and showed its worst reading in 40 years. The sell-off was broad with declining stocks outnumbering the advancing ones by a ratio of 9 to 1.
The Consumer Price Index reached its highest level since 1981, as prices were rising 8.6% YoY and 6% when excluding the food and energy components. Expectations were for 8.3% and 5.9% respectively.
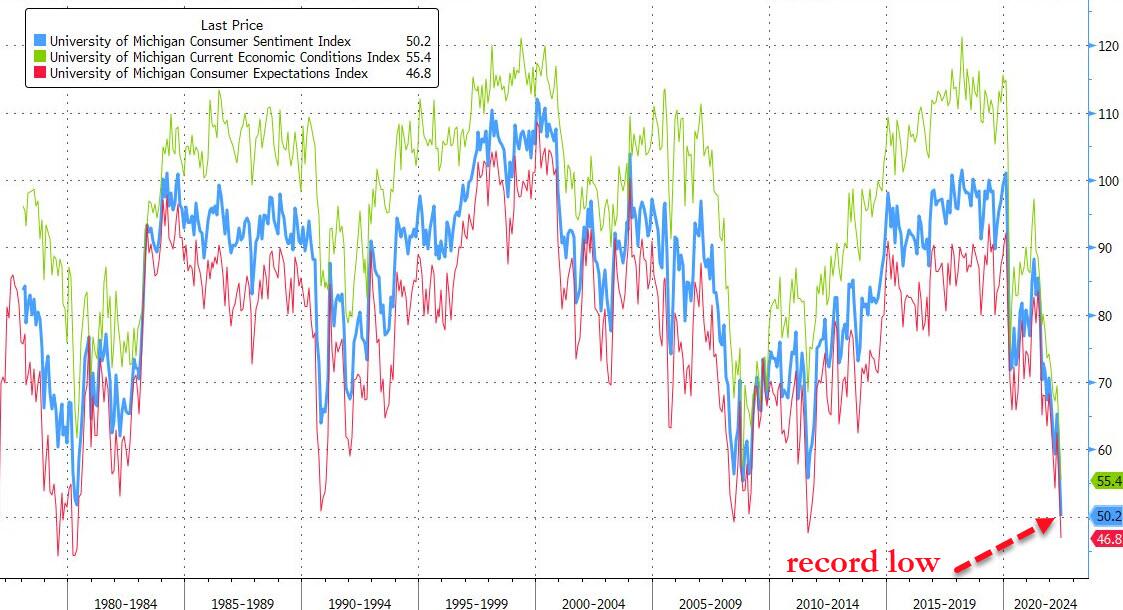
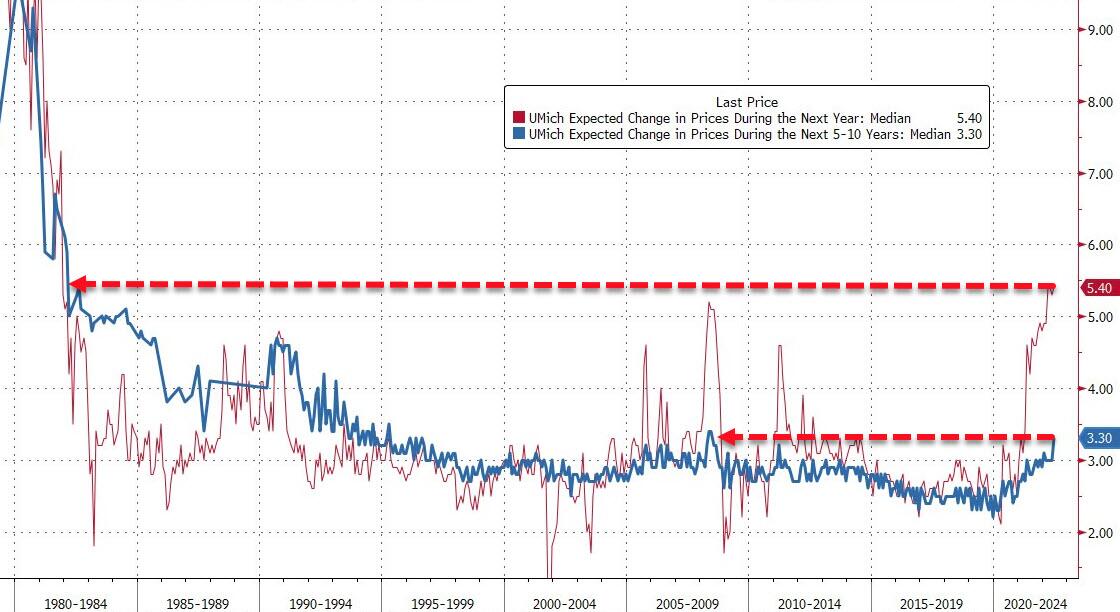
As ZeroHedge added, Consumer Sentiment collapsed to a record low by crashing from 58.4 to 50.2, which was massively below expectations of 58.1. Inflation expectations soared, while buying conditions collapsed to new lows.
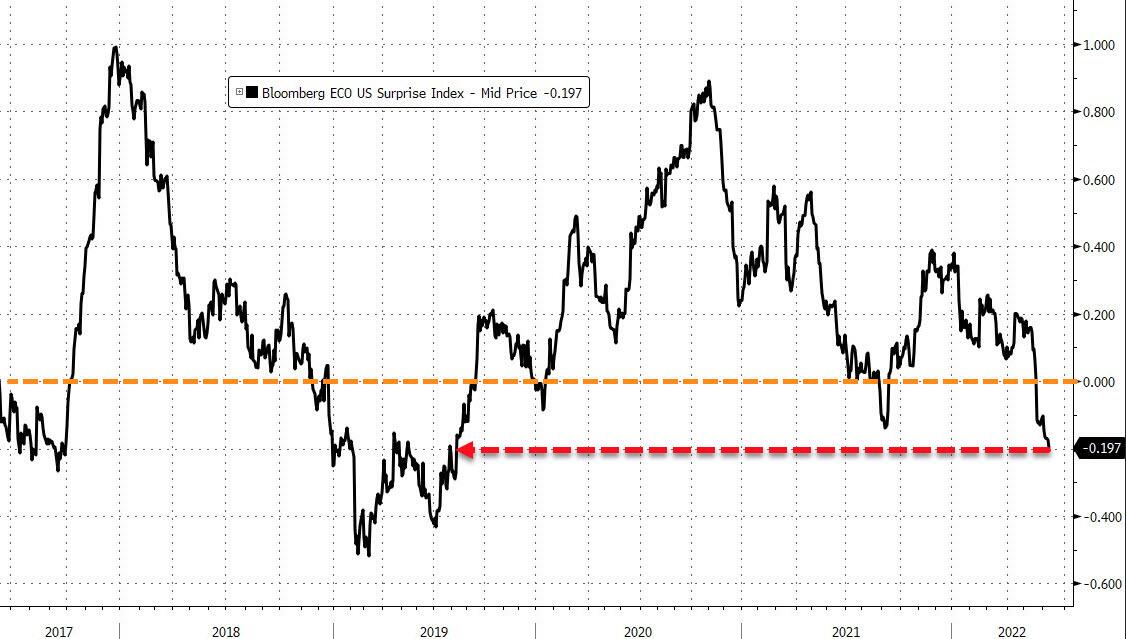
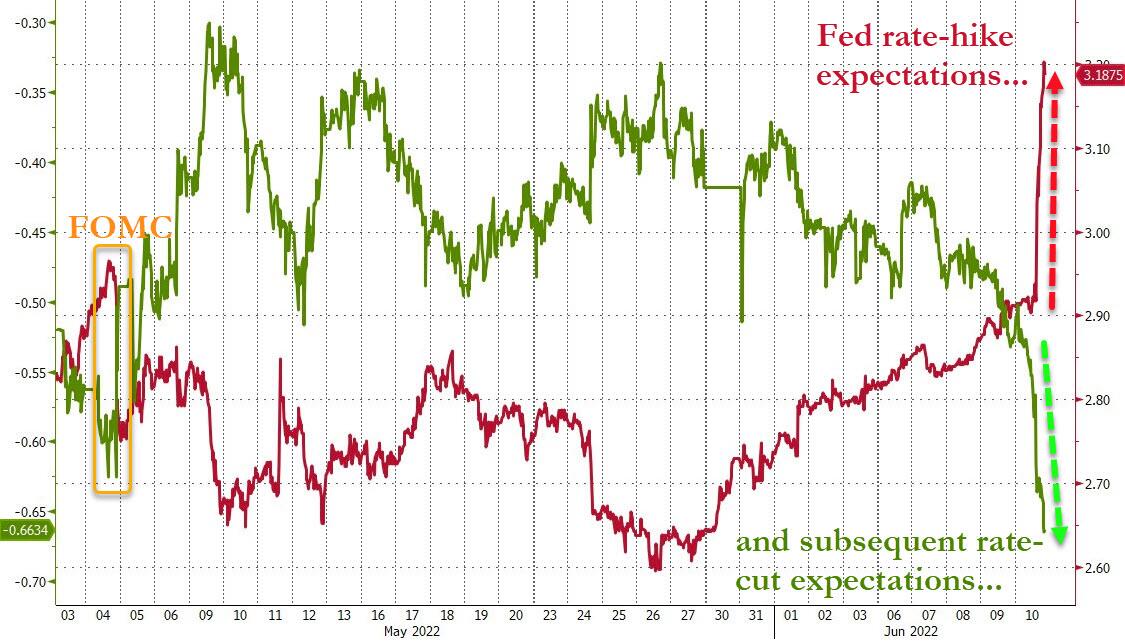
The US Macro Surprise Index followed suit and dipped to its weakest since 2019. The reactions in the markets were violent no matter where you looked, with rate-hike expectations and rate-cut expectations going opposite ways, as Bloomberg demonstrates in this chart.
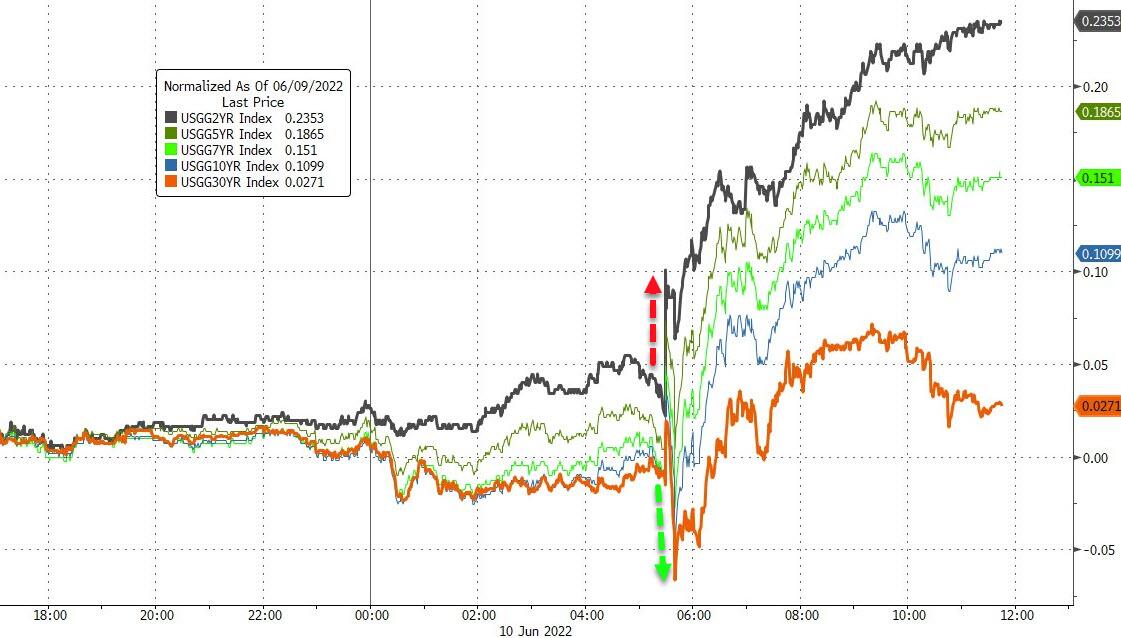
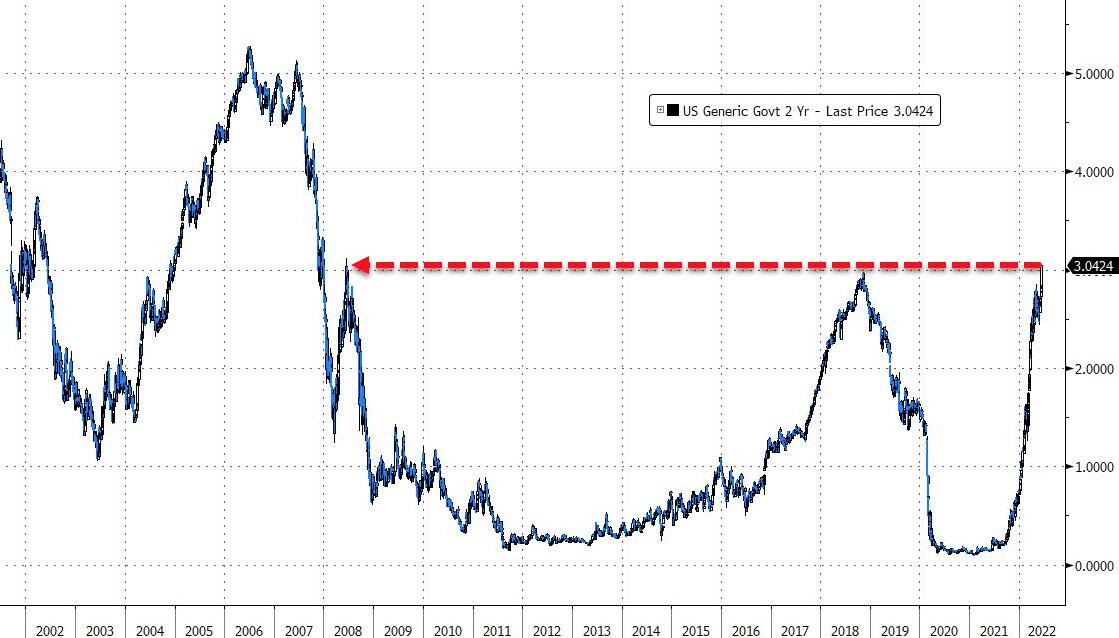
Bond markets were in turmoil due to yields spiking violently, with the 10-year adding over 11 basis points to close at 3.157%. For the week, it was simply a bloodbath, as the 2-year bond yield exploded by a stunning 40 basis points, and topping 3% for the first time since 2008, while the 30-year only gained 10 basis points.
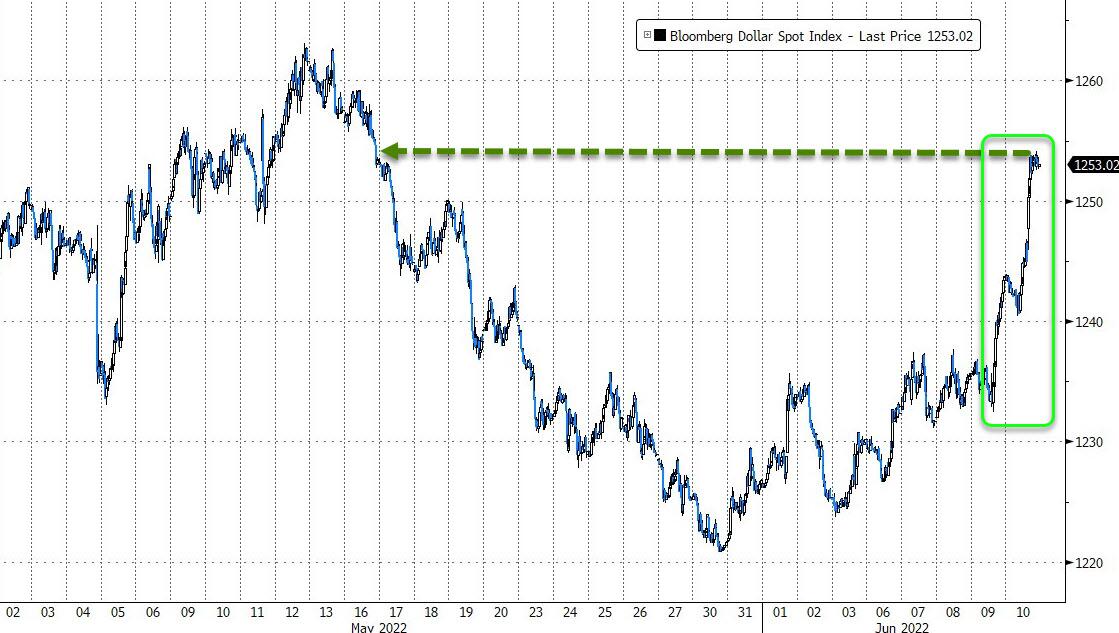
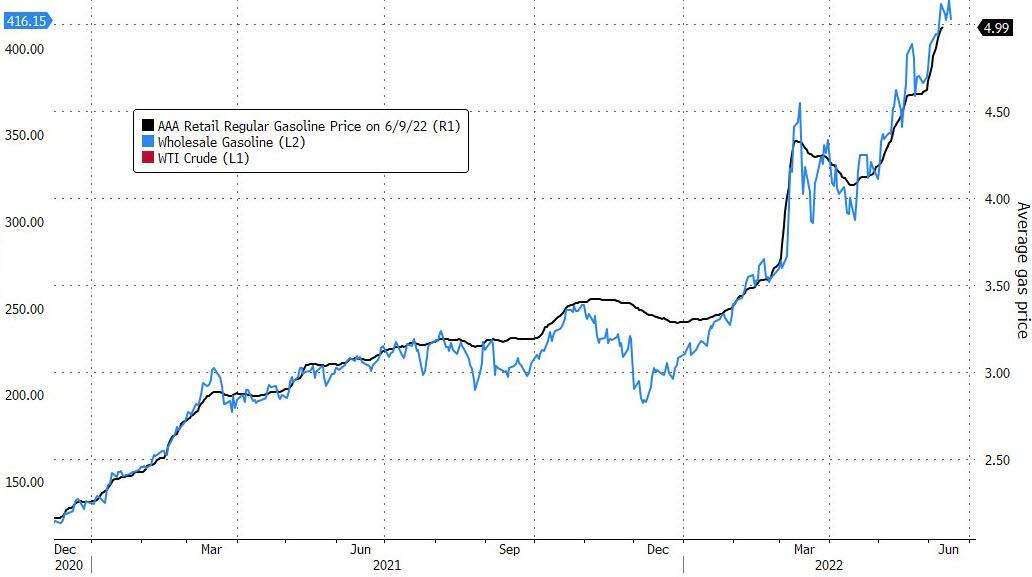
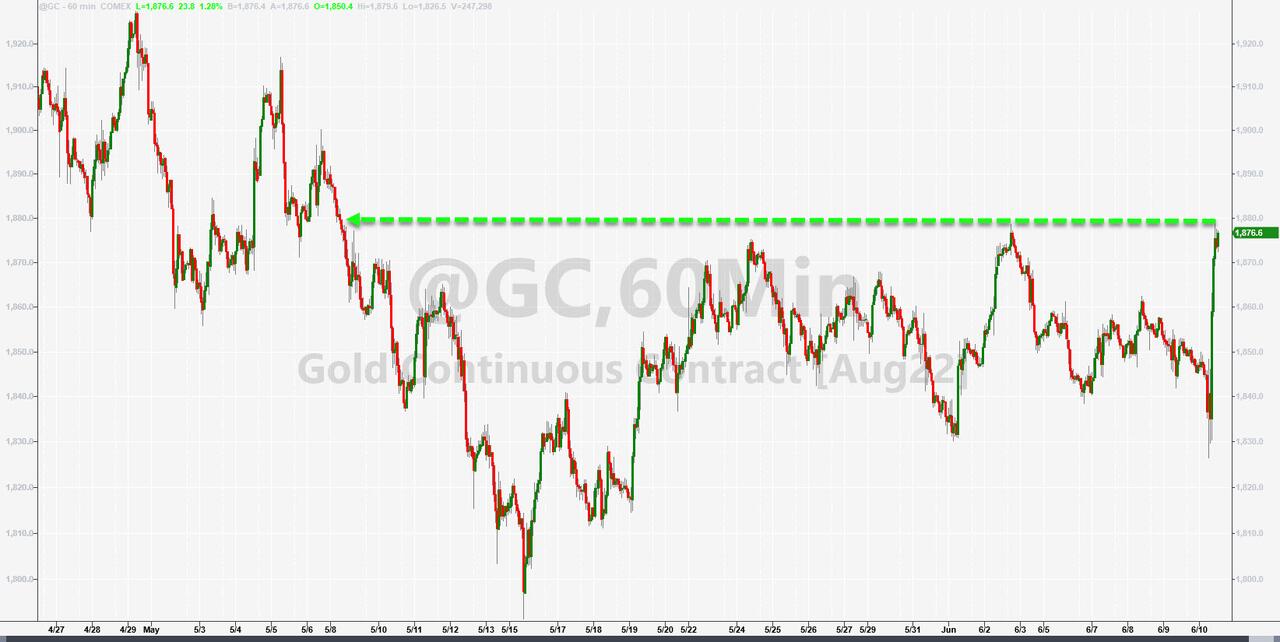
The US Dollar rallied, as did gasoline prices, while Gold was the safe place to be in the face of chaos, as the precious metal surged 1.23% on the day and easily reclaimed its $1,850 level.
We ended the week, as ZH posted, with the S&P 500 and Nasdaq not only having their worst week since January 2021, but also witnessing the S&P 500 down 10 of the last 11 weeks—the worst stretch since the Great Depression.
Being in cash on the sidelines never felt so good.
2. ETFs in the Spotlight
In case you missed the announcement and description of this section, you can read it here again.
It features some of the 10 broadly diversified domestic and sector ETFs from my HighVolume list as posted every Saturday. Furthermore, they are screened for the lowest MaxDD% number meaning they have been showing better resistance to temporary sell offs than all others over the past year.
The below table simply demonstrates the magnitude with which these ETFs are fluctuating above or below their respective individual trend lines (%+/-M/A). A break below, represented by a negative number, shows weakness, while a break above, represented by a positive percentage, shows strength.
For hundreds of ETF choices, be sure to reference Thursday’s StatSheet.
For this closed-out domestic “Buy” cycle (2/24/2022), here’s how some of our candidates have fared:
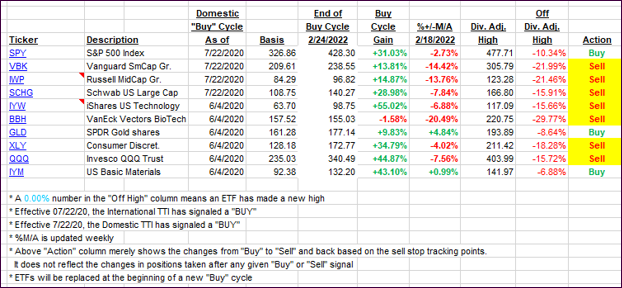
Click image to enlarge.
Again, the %+/-M/A column above shows the position of the various ETFs in relation to their respective long-term trend lines, while the trailing sell stops are being tracked in the “Off High” column. The “Action” column will signal a “Sell” once the -12% point has been taken out in the “Off High” column, which has replaced the prior -8% to -10% limits.
3. Trend Tracking Indexes (TTIs)
Our TTIs swan dived deeper into bear market territory and reached a level that we have not seen in a few weeks.
This is how we closed 06/10/2022:
Domestic TTI: -8.58% below its M/A (prior close -4.03%)—Sell signal effective 02/24/2022.
International TTI: -8.07% below its M/A (prior close -3.75%)—Sell signal effective 03/08/2022.
Disclosure: I am obliged to inform you that I, as well as my advisory clients, own some of the ETFs listed in the above table. Furthermore, they do not represent a specific investment recommendation for you, they merely show which ETFs from the universe I track are falling within the specified guidelines.
All linked charts above are courtesy of Bloomberg via ZeroHedge.
———————————————————-
WOULD YOU LIKE TO HAVE YOUR INVESTMENTS PROFESSIONALLY MANAGED?
Do you have the time to follow our investment plans yourself? If you are a busy professional who would like to have his portfolio managed using our methodology, please contact me directly to get more details.
Contact Ulli