
- Moving the markets
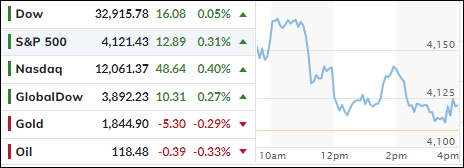
Another head fake session saw the Dow gaining over 300-points early on, but the rally quickly lost steam with the major indexes briefly dipping into the red, before a late push saved the day. The Dow settled at about unchanged, but the S&P 500 eked out a modest 0.31% advance.
The early boost was a result of China rolling back some of its Covid restriction, which traders interpreted as their economy returning to near capacity within a month. That should be a boon to the global economy and would hopefully ease the supply chain issues.
Still, uncertainty abounds that the Fed might raise interest rates too fast and too much creating a recession in the process. Well, you can’t have it both ways, as the Fed has only limited options. Either fight inflation fast and furious and risk a recession, or be too easy and watch hyper inflation create havoc. Take your poison.
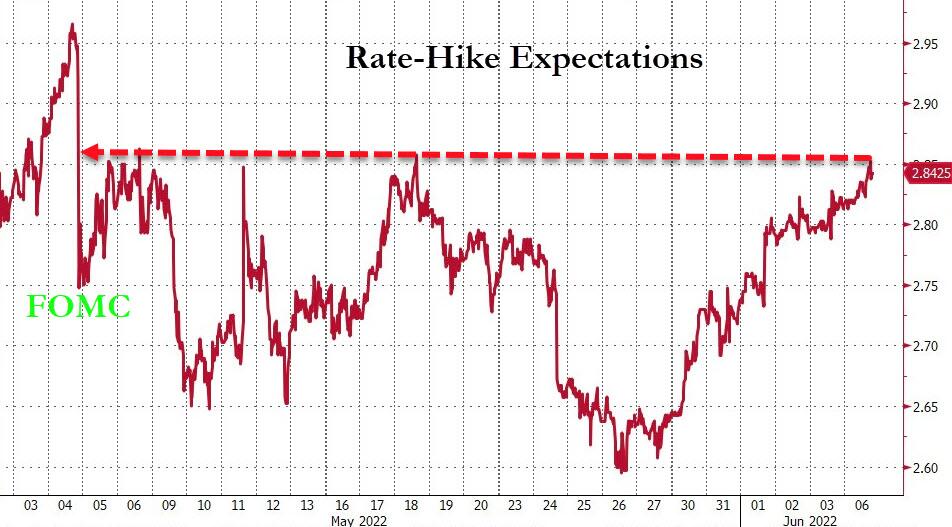
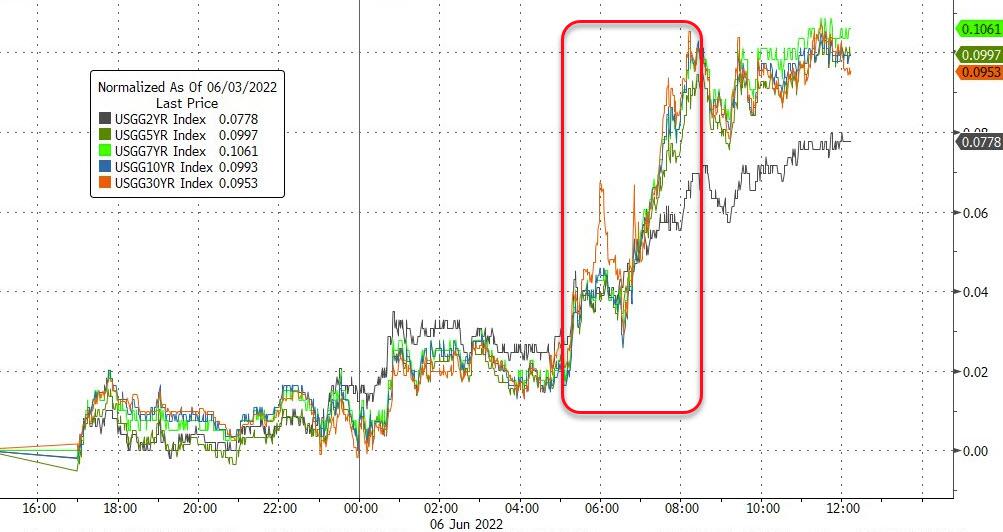
Rate hike expectations climbed to its highest level since the May Fed meeting with bond yields ripping higher, as the 10-year added over 10 basis points to recapture the 3% level to close at 3.045%.
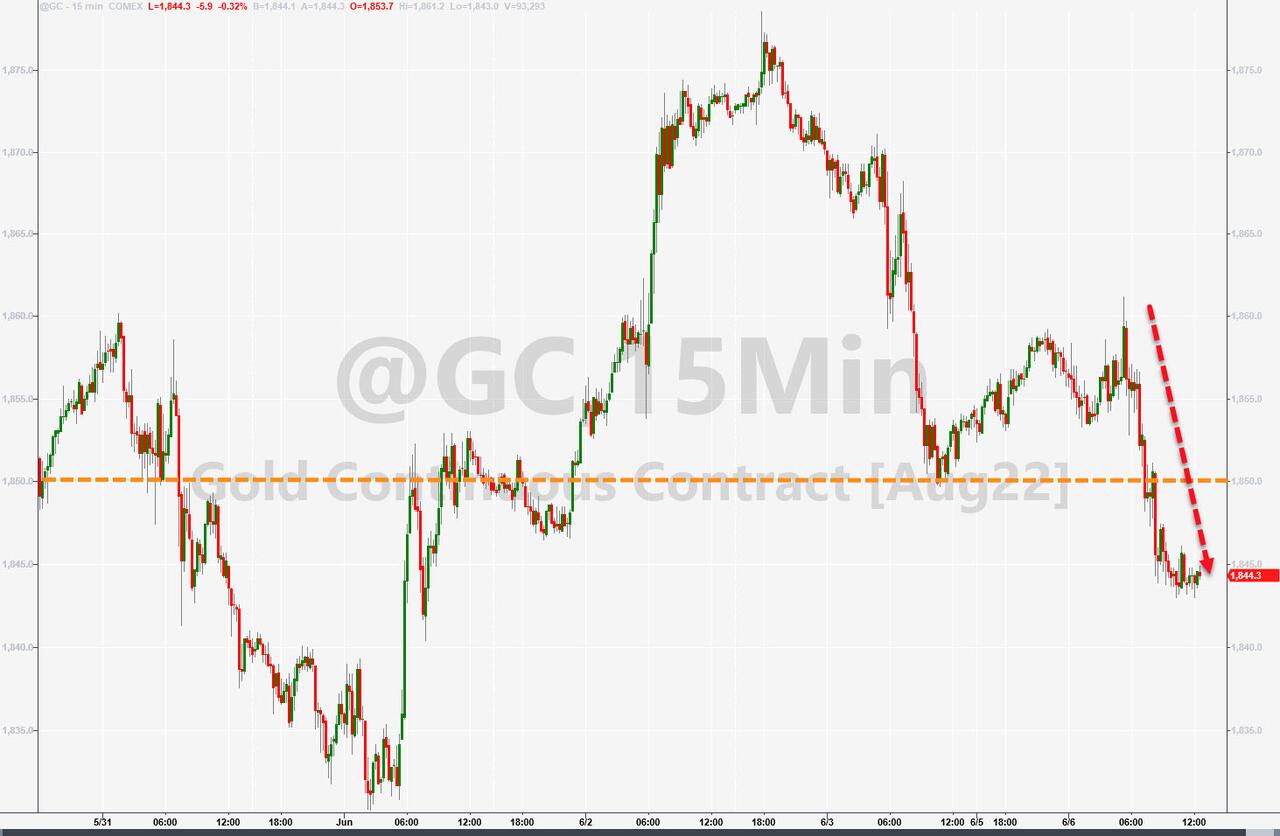
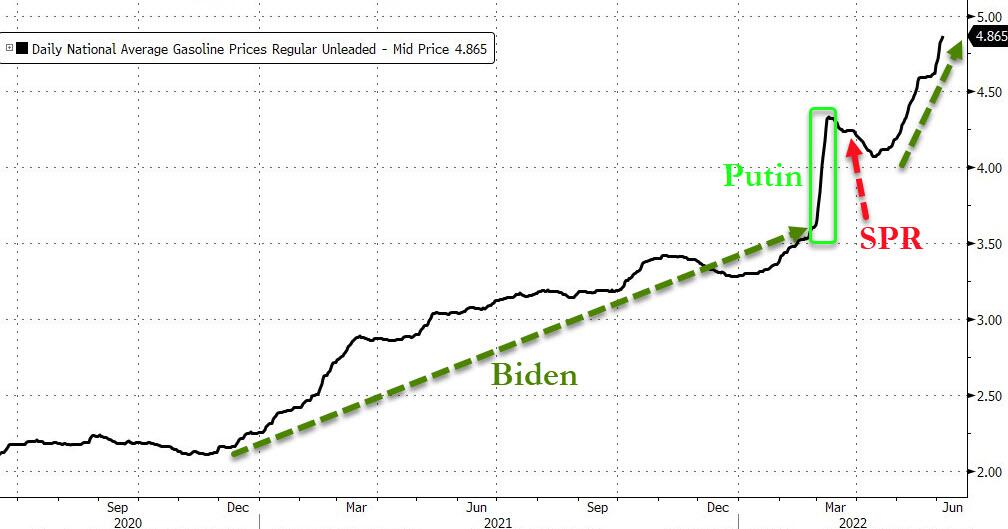
That helped the US Dollar to reverse its downtrend and wipe out early losses. Gold dropped on dollar strength and gave back its $1,850 level in the process. Unfortunately, gasoline prices hit another record high, as ZH reported, which appears to be now an almost daily occurrence.
2. ETFs in the Spotlight
In case you missed the announcement and description of this section, you can read it here again.
It features some of the 10 broadly diversified domestic and sector ETFs from my HighVolume list as posted every Saturday. Furthermore, they are screened for the lowest MaxDD% number meaning they have been showing better resistance to temporary sell offs than all others over the past year.
The below table simply demonstrates the magnitude with which these ETFs are fluctuating above or below their respective individual trend lines (%+/-M/A). A break below, represented by a negative number, shows weakness, while a break above, represented by a positive percentage, shows strength.
For hundreds of ETF choices, be sure to reference Thursday’s StatSheet.
For this closed-out domestic “Buy” cycle (2/24/2022), here’s how some of our candidates have fared:
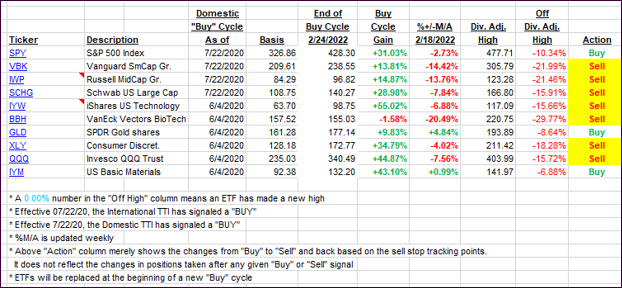
Click image to enlarge.
Again, the %+/-M/A column above shows the position of the various ETFs in relation to their respective long-term trend lines, while the trailing sell stops are being tracked in the “Off High” column. The “Action” column will signal a “Sell” once the -12% point has been taken out in the “Off High” column, which has replaced the prior -8% to -10% limits.
3. Trend Tracking Indexes (TTIs)
Our TTIs improved slightly, because the major indexes managed to eke out a small gain.
This is how we closed 06/06/2022:
Domestic TTI: -3.57% below its M/A (prior close -3.92%)—Sell signal effective 02/24/2022.
International TTI: -3.50% below its M/A (prior close -3.80%)—Sell signal effective 03/08/2022.
Disclosure: I am obliged to inform you that I, as well as my advisory clients, own some of the ETFs listed in the above table. Furthermore, they do not represent a specific investment recommendation for you, they merely show which ETFs from the universe I track are falling within the specified guidelines.
All linked charts above are courtesy of Bloomberg via ZeroHedge.
Contact Ulli