
- Moving the markets
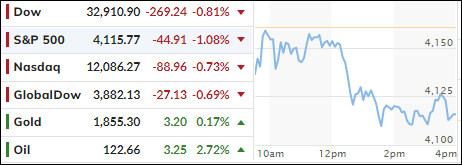
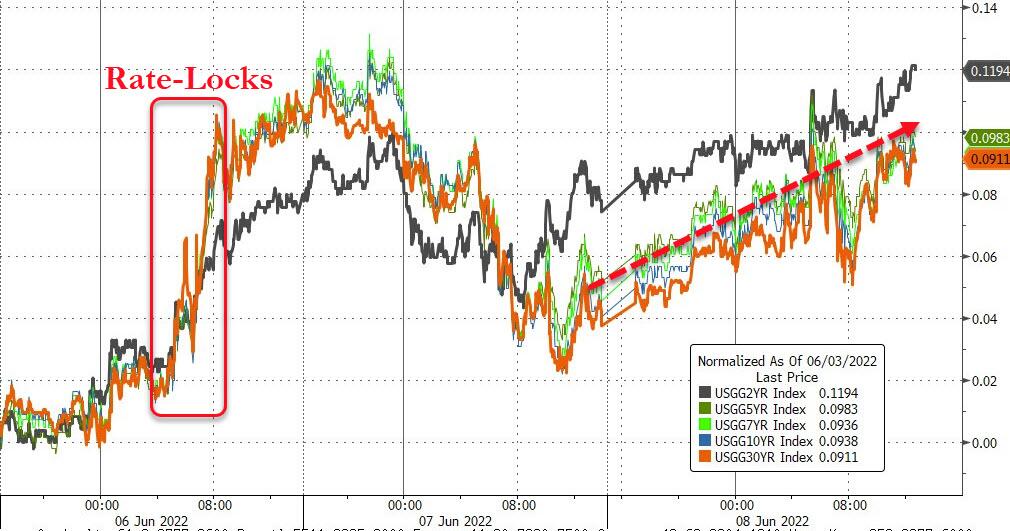
The roller coaster ride continued, as yesterday’s rebound vanished in a hurry, with the major indexes giving back more than they gained in the prior session. Bonds reversed Tuesday’s yield slippage with yields rising and the 10-year reclaiming its 3% level by closing at 3.03%.
Updates and warnings from major companies (Credit Suisse, Intel) contributed to equity weakness amid signs that economic growth is not what it was cracked up to be. In other words, we are slowing down with the Stagflation scenario becoming more real every day.
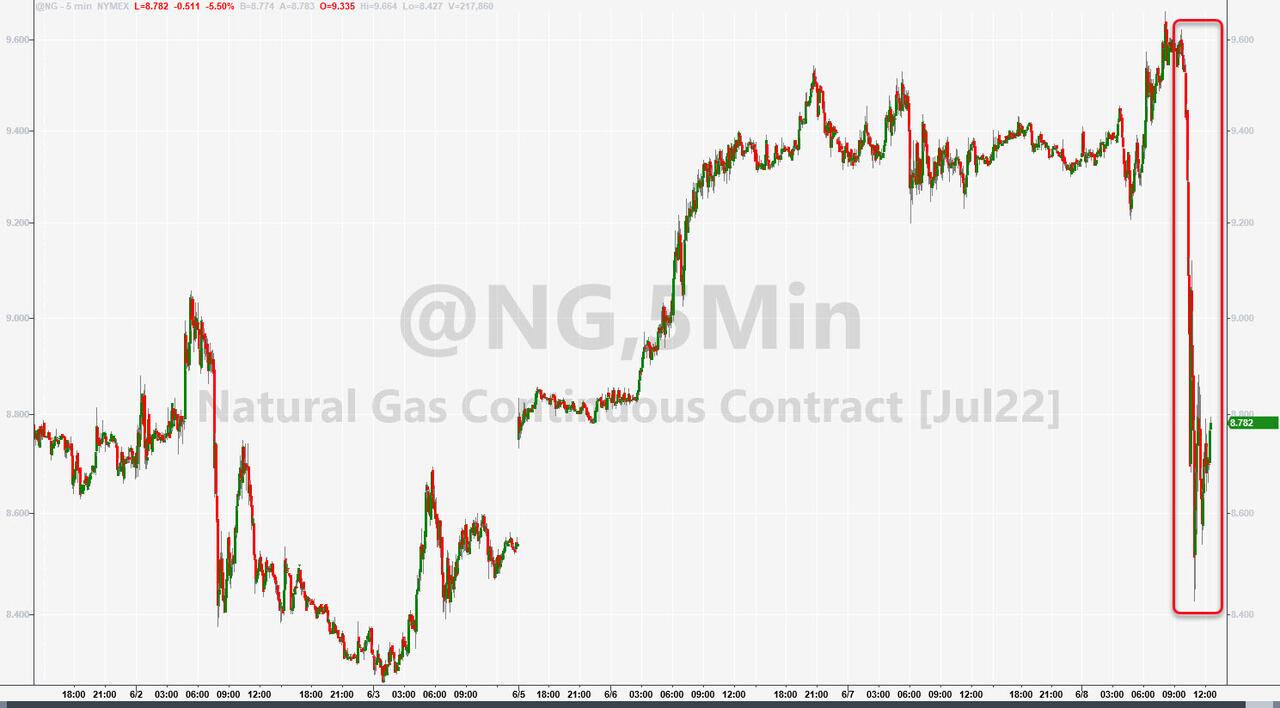
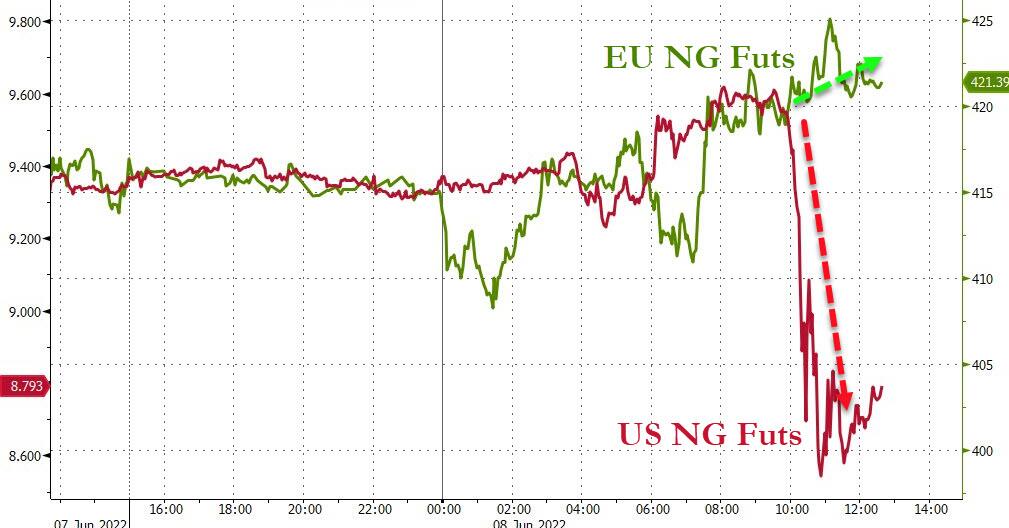
Things are starting to affect the housing market, because mortgage demand hit its lowest level in 22 years, as per the Mortgage Bankers Association. A rally in Crude Oil to over $122 only created more anxiety, but Natural Gas plunged due to a small terminal explosion. ZH explained that less exports means more domestic supply, hence the sell off. The reverse happened in Europe, as their supplies were cut and prices subsequently rose.
On deck for Friday is the highly anticipated CPI number for May. It’s reading could influence the path of Fed policy in terms of frequency (a potential pause) and magnitude (0.5% increments) and therefore affect market direction as well.
2. ETFs in the Spotlight
In case you missed the announcement and description of this section, you can read it here again.
It features some of the 10 broadly diversified domestic and sector ETFs from my HighVolume list as posted every Saturday. Furthermore, they are screened for the lowest MaxDD% number meaning they have been showing better resistance to temporary sell offs than all others over the past year.
The below table simply demonstrates the magnitude with which these ETFs are fluctuating above or below their respective individual trend lines (%+/-M/A). A break below, represented by a negative number, shows weakness, while a break above, represented by a positive percentage, shows strength.
For hundreds of ETF choices, be sure to reference Thursday’s StatSheet.
For this closed-out domestic “Buy” cycle (2/24/2022), here’s how some of our candidates have fared:
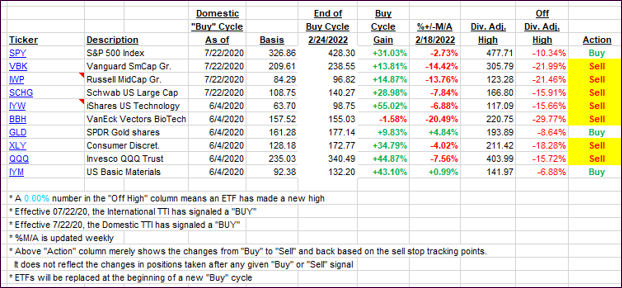
Click image to enlarge.
Again, the %+/-M/A column above shows the position of the various ETFs in relation to their respective long-term trend lines, while the trailing sell stops are being tracked in the “Off High” column. The “Action” column will signal a “Sell” once the -12% point has been taken out in the “Off High” column, which has replaced the prior -8% to -10% limits.
3. Trend Tracking Indexes (TTIs)
Our TTIs reversed and moved further away from their respective trend lines.
This is how we closed 06/08/2022:
Domestic TTI: -4.03% below its M/A (prior close -2.65%)—Sell signal effective 02/24/2022.
International TTI: -3.75% below its M/A (prior close -3.07%)—Sell signal effective 03/08/2022.
Disclosure: I am obliged to inform you that I, as well as my advisory clients, own some of the ETFs listed in the above table. Furthermore, they do not represent a specific investment recommendation for you, they merely show which ETFs from the universe I track are falling within the specified guidelines.
All linked charts above are courtesy of Bloomberg via ZeroHedge.
Contact Ulli