Below, please find the latest High-Volume ETF Cutline report, which shows how far above or below their respective long-term trend lines (39-week SMA) my currently tracked ETFs are positioned.
This report covers the HV ETF Master List from Thursday’s StatSheet and includes 312 High Volume ETFs, defined as those with an average daily volume of more than $5 million, of which currently 171 (last week 177) are hovering in bullish territory. The yellow line separates those ETFs that are positioned above their trend line (%M/A) from those that have dropped below it.
In case you are not familiar with some of the terminology used in the reports, please read the Glossary of Terms. If you missed the original post about the Cutline approach, you can read it here.
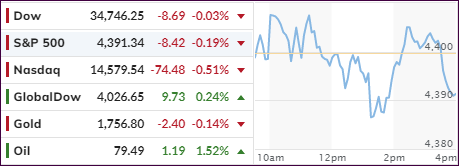
It was a good news bad news scenario as the latter, namely a disappointing jobs report faced the former, that is optimism about the short-term debt ceiling bill, which has pushed the ultimate decision into early December.
The jobs report itself offered a similar scenario with the disappointment being the meager addition of only 194k jobs in September, which was well below expectations of 500k.
Coming in as a positive surprise was the unemployment rate, which fell to 4.8%, much lower than forecast, to a level last seen in 2016. Adding to the slightly bullish mood was the August jobs report, which was revised up to 366k from the initial 235k.
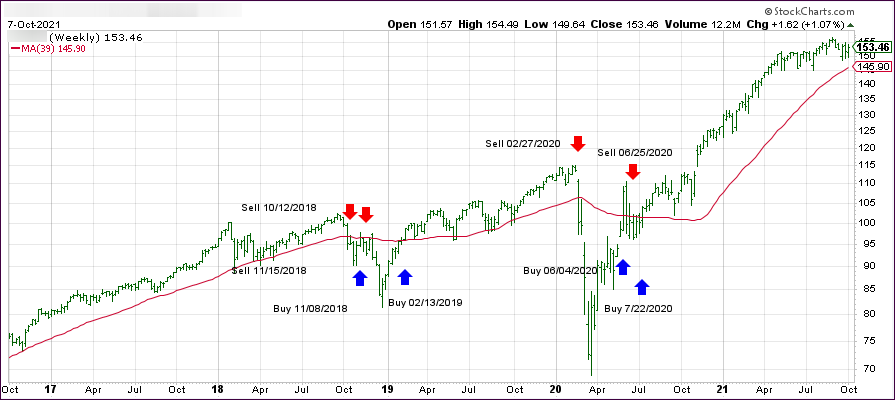
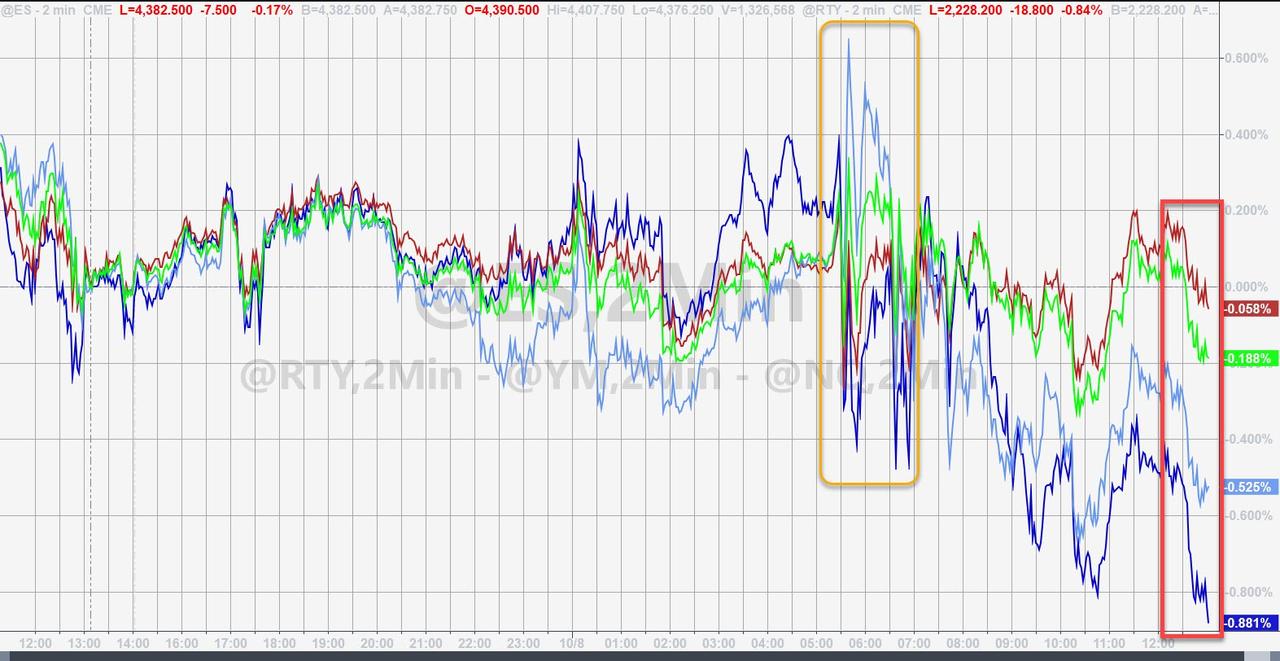
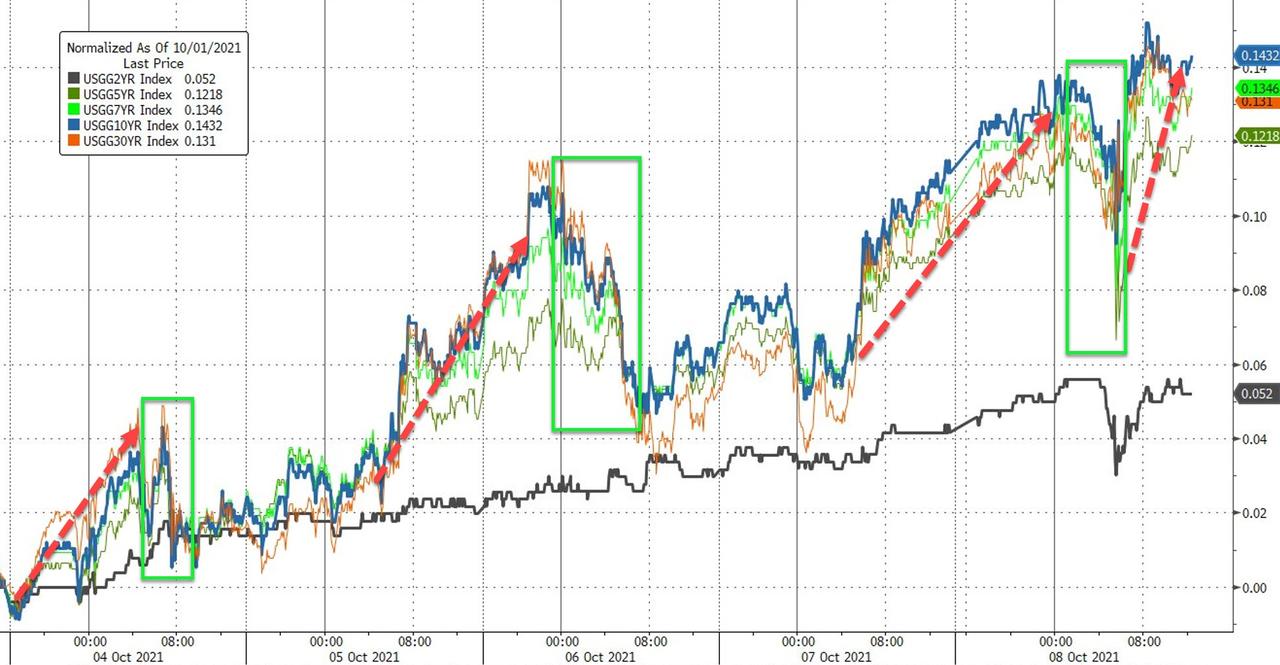
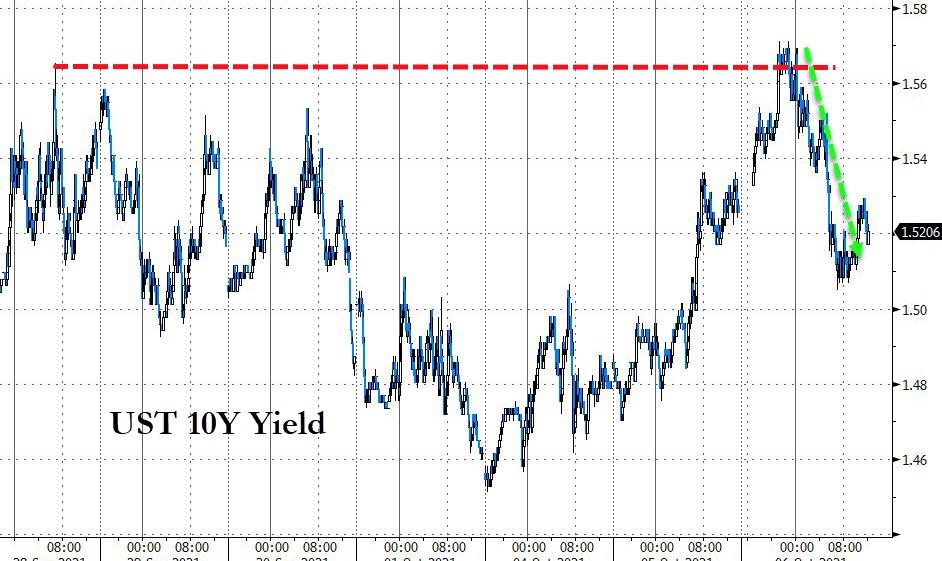
It was a volatile week, but equities hung in there despite debt ceiling uncertainty, but be aware that market risk remains due spiking inflation, Covid concerns and exploding bond yields with the weekly chart looking like this.
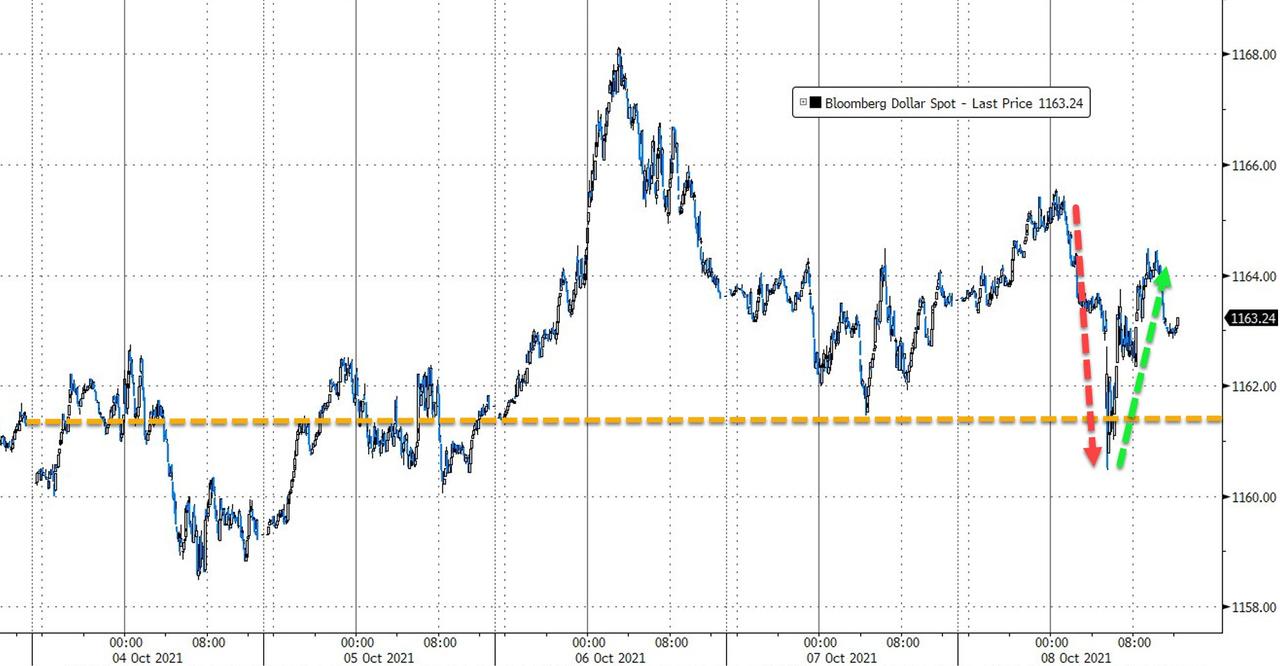
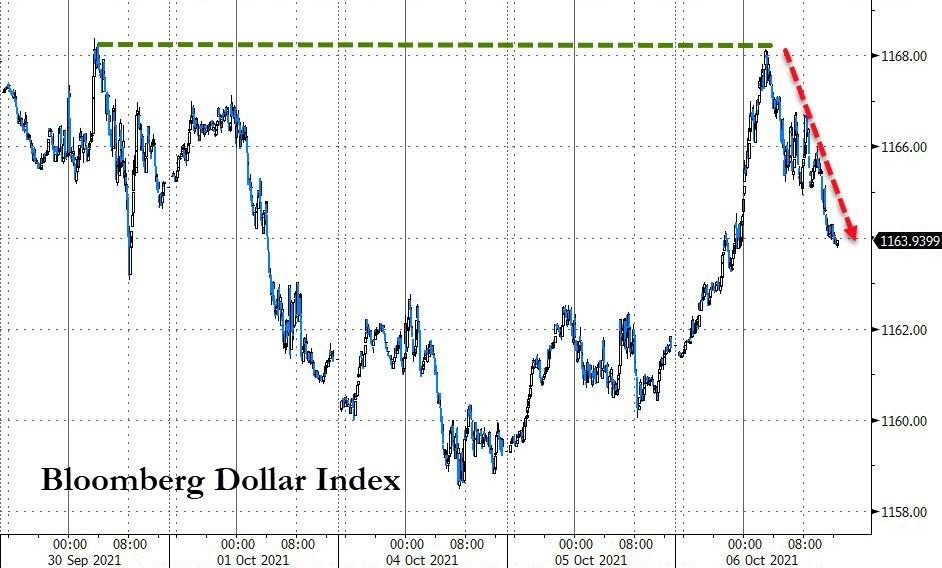
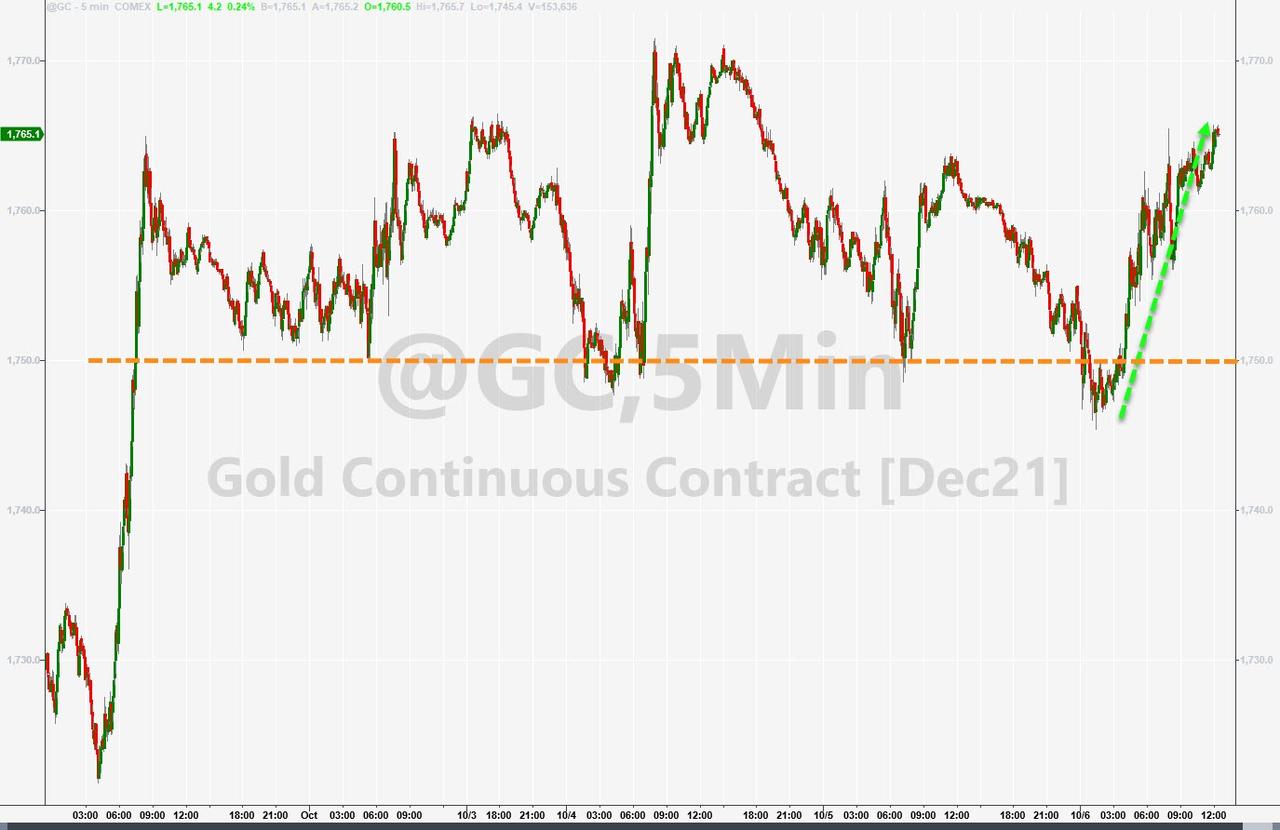
The US Dollar did an about face today, plunging first on news of dismal jobs data but then recovering and ending the week higher. Gold was directionless and ended the week flat.
On deck next week is the start of earnings season, which also can offer unexpected surprises.
ETF Data updated through Thursday, October 7, 2021
Methodology/Use of this StatSheet:
1. From the universe of over 1,800 ETFs, I have selected only those with a trading volume of over $5 million per day (HV ETFs), so that liquidity and a small bid/ask spread are assured.
2. Trend Tracking Indexes (TTIs)
Buy or Sell decisions for Domestic and International ETFs (section 1 and 2), are made based on the respective TTI and its position either above or below its long-term M/A (Moving Average). A crossing of the trend line from below accompanied by some staying power above constitutes a “Buy” signal. Conversely, a clear break below the line constitutes a “Sell” signal. Additionally, I use an 8% trailing stop loss on all positions in these categories to control downside risk.
3. All other investment arenas do not have a TTI and should be traded based on the position of the individual ETF relative to its own respective trend line (%M/A). That’s why those signals are referred to as a “Selective Buy.” In other words, if an ETF crosses its own trendline to the upside, a “Buy” signal is generated. Since these areas tend to be more volatile, I recommend a wider trailing sell stop of 8%-10% depending on your risk tolerance.
If you are unfamiliar with some of the terminology, please see Glossary of Termsand new subscriber information in section 9.
1. DOMESTIC EQUITY ETFs: BUY— since 07/22/2020
Click on chart to enlarge
Our main directional indicator, the Domestic Trend Tracking Index (TTI-green line in the above chart) has now rallied above its long-term trend line (red) by +5.62% and remains in “BUY” mode as posted.
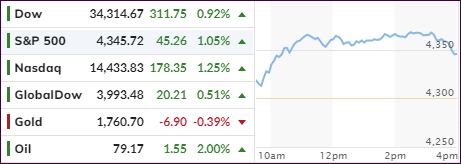
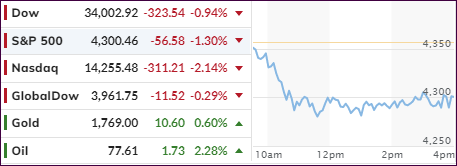
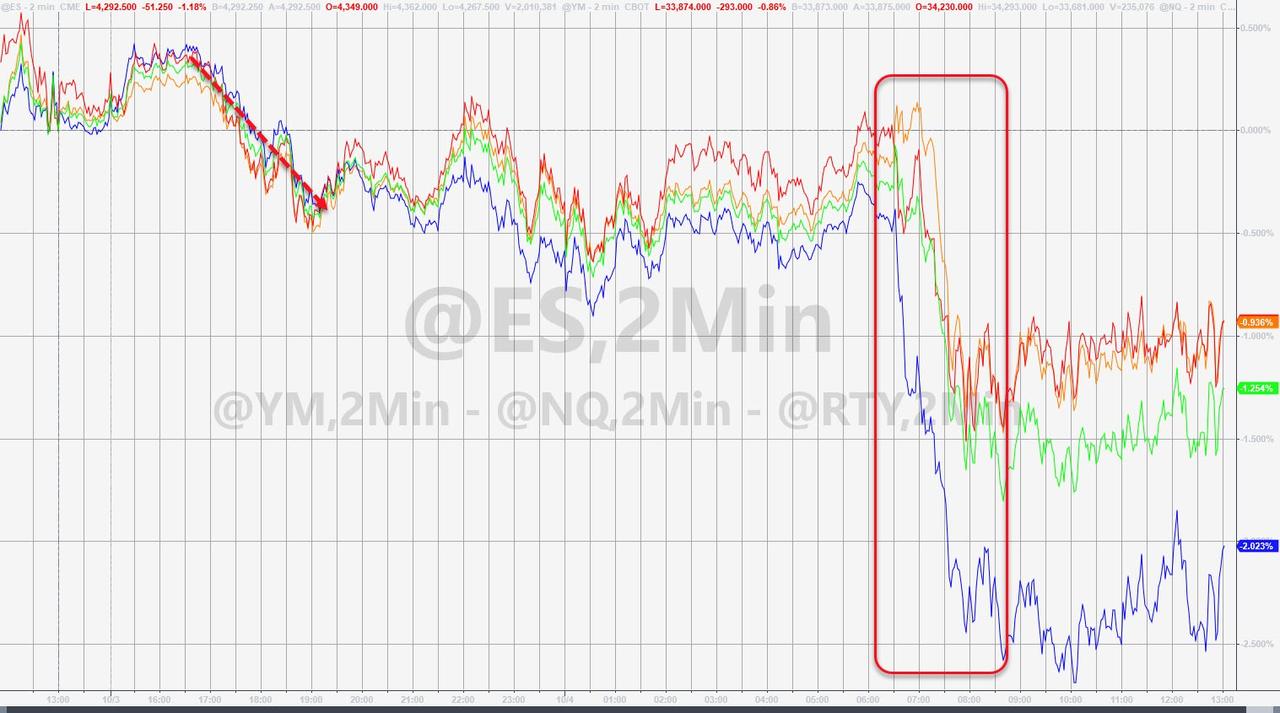
During the early part of today’s session, the market ping-pong continued, when the major indexes took a steep dive with the Dow down some 400 points and on pace to again wipe out the previous day’s gains.
However, a slow but steady rebound ensued with equities digging themselves out of a deep hole and scoring a green close, the second one in a row. This rebound was supported by optimism about a debt ceiling deal, causing traders to jump back into the much-neglected tech sector.
CNBC called it this way:
Stocks reversed course on news that Senate Minority Leader Mitch McConnell told a closed meeting of Republicans that he would offer a short-term debt ceiling extension later Wednesday. That would help relieve some pressure on Congress to avoid a U.S. default currently expected on Oct. 18.
As a result, the dip was bought, despite nagging concerns about risings interest rates, surging inflation, the state of reopening, and the debt limit being on everyone’s mind.
Bond yields spiked and then tumbled but closed higher with the 10-year ramping to almost 1.57%, before pulling back into the close and ending the day at 1.528%.
The US Dollar moved in similar fashion, first up and then down, but it also closed higher for the session.
The roller coaster ride in both, bond yields and the dollar, aided Gold for the day with the precious metal bouncing moderately and scoring a gain of 0.23%.
So far, the month of October has sure lived up to its reputation as the most volatile month of the year. And we’re only 6 days into it.
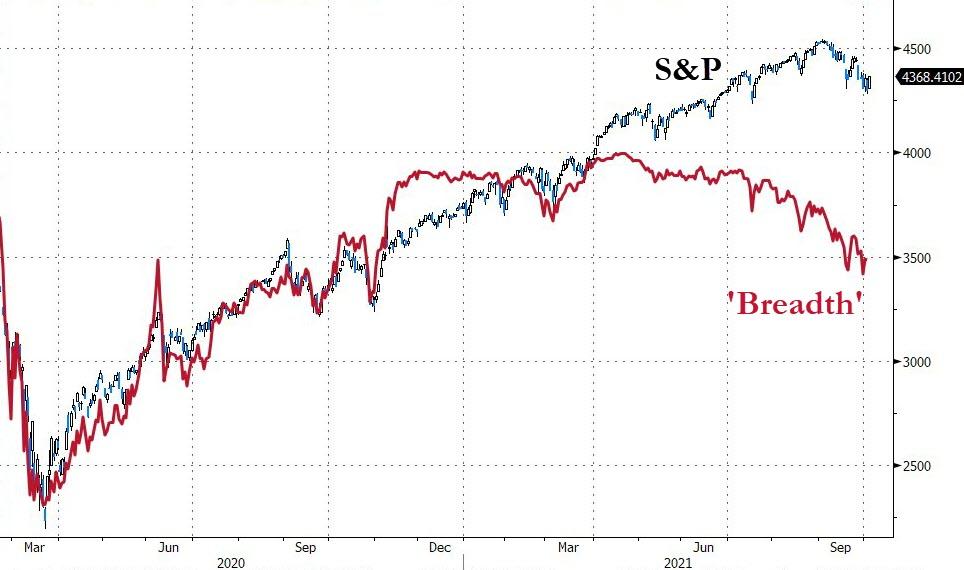
We have now witnessed a continued roller coaster with no clear direction but huge daily swings in equities. Over the past 4 trading days, we noted this pattern: down, up, down, up with today’s rally bringing the S&P 500 just about back to last Wednesday’s price. In other words, not much was gained or lost, but with “breadth” being indicative of more downside to come.
Despite its recent weakness, the Nasdaq finally stormed back outperforming the other two major indexes, at least for this session. In the recent past, we saw a tale of two markets with stocks tied to the economic recovery battling Big Tech, with the latter struggling during the past month, but today both gained.
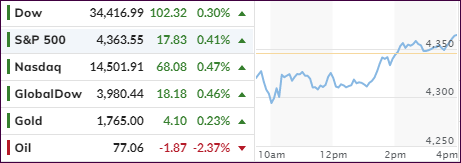
After yesterday’s market drubbing, an unexpected assist surfaced this morning, as news spread that Senator Manchin’s stern view of the Biden infrastructure package may be showing signs of cracking with him now not ruling out a $1.9-2.2 trillion social spending plan. That is much higher than his earlier number of around $1.5 trillion.
That was music to the ears of traders on Wall Street and off we went. While the markets came off their highs in the end, it was nevertheless a solid recovery from yesterday’s debacle.
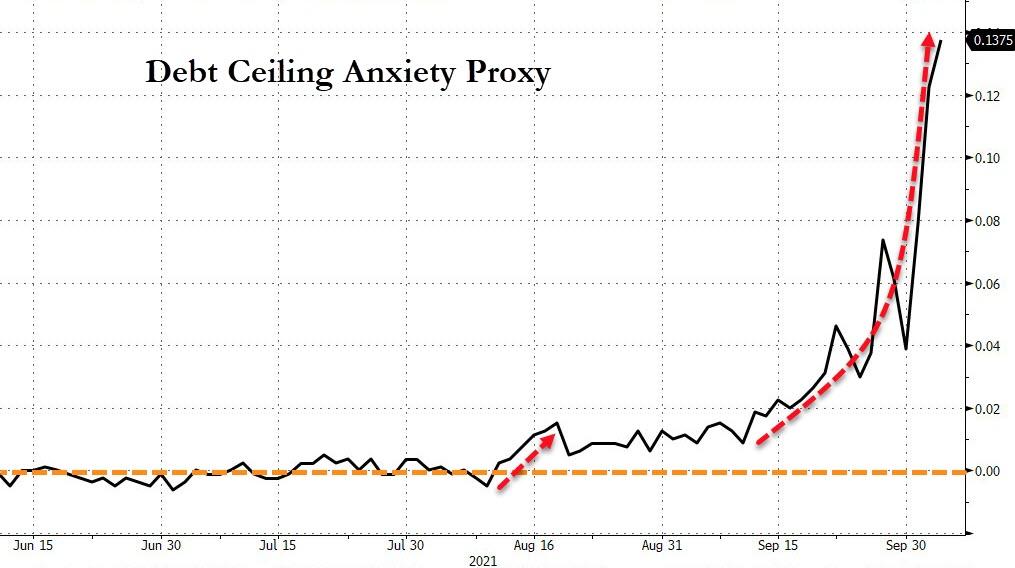
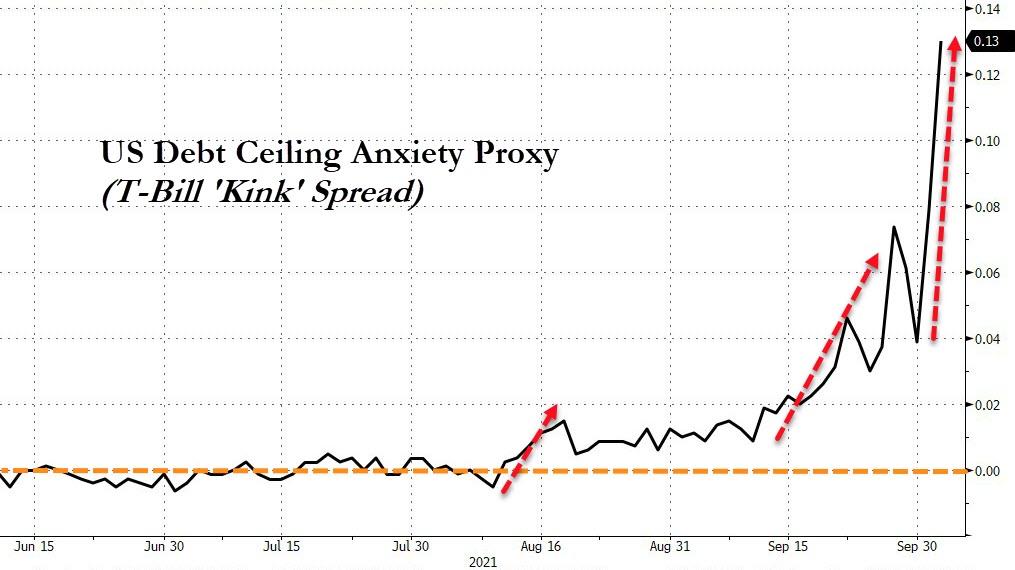
Despite the warm fuzzies that today’s rebound evoked, debt ceiling doubts continue to spread, as this chart shows. Of course, we’ve seen that tug-of-war for decades, followed by last-minute compromises, but it still leaves me wondering “will it be different this time?”
The US Dollar index rallied and bond yields surged, thereby leaving gold in the dust with the precious metal dipping 0.38%.
After Friday’s levitation to start the month of October on a positive note, much of that enthusiasm waned, as the mood soured thereby pushing the major indexes into the red. The Dow fared the best and the Nasdaq the worst, because of higher interest rates exacting another pound of flesh from this sector.
Unless bond yields do an about face and head south again, the Nasdaq won’t have much of a chance to recover. Right now, one of our tech holdings is nibbling at its trailing sell stop and will be liquidated upon breaking through this predetermined level.
Added Jim Paulsen, a chief investment strategist:
The financial markets are adjusting leadership to reflect another Covid-induced reopening cycle. That is, commodities are rising, bond yields are rising, cyclical sectors and small cap stocks are outpacing, and technology and growth stocks in general are underperforming.
Of course, the entire stock market is operating at extremely lofty levels, so it’s as no surprise that corrections will come into play. The question in my mind is whether these are just temporary pullbacks, or is something more sinister brewing in the background that will pull equities much lower and into bear market territory?
I think the odds currently are favoring that scenario when considering the barrage of unknowns that is bombarding the markets daily. For example, the ever-increasing inflation risks, Federal Reserve tapering, rising bond yields, supply chain disruptions, the debt ceiling anxiety, the Evergrande bond default and higher taxes all add poison to this cocktail called the stock market.
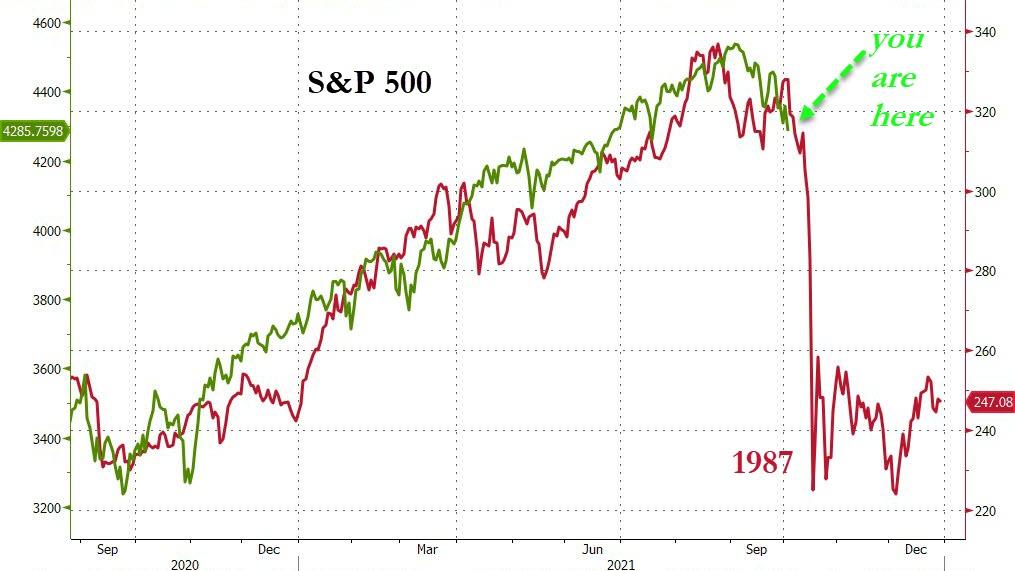
Fortunately, we don’t have to guess which way things will turn. Because we will let our trailing sell stops and Trend Tracking Indexes (TTIs) be our guide to advise us when it’s time to reduce our risk by moving to the safety of the sidelines.
Is this chart indicating that we are getting close?

