
- Moving the markets
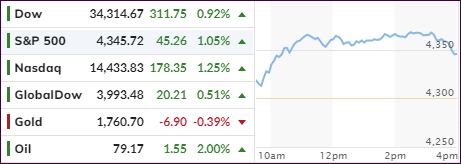
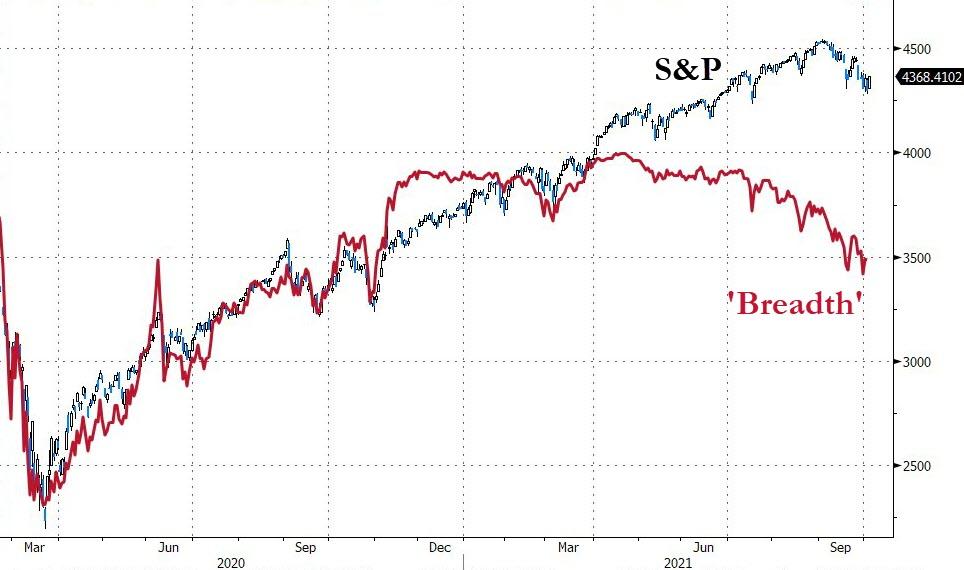
We have now witnessed a continued roller coaster with no clear direction but huge daily swings in equities. Over the past 4 trading days, we noted this pattern: down, up, down, up with today’s rally bringing the S&P 500 just about back to last Wednesday’s price. In other words, not much was gained or lost, but with “breadth” being indicative of more downside to come.
Despite its recent weakness, the Nasdaq finally stormed back outperforming the other two major indexes, at least for this session. In the recent past, we saw a tale of two markets with stocks tied to the economic recovery battling Big Tech, with the latter struggling during the past month, but today both gained.
After yesterday’s market drubbing, an unexpected assist surfaced this morning, as news spread that Senator Manchin’s stern view of the Biden infrastructure package may be showing signs of cracking with him now not ruling out a $1.9-2.2 trillion social spending plan. That is much higher than his earlier number of around $1.5 trillion.
That was music to the ears of traders on Wall Street and off we went. While the markets came off their highs in the end, it was nevertheless a solid recovery from yesterday’s debacle.
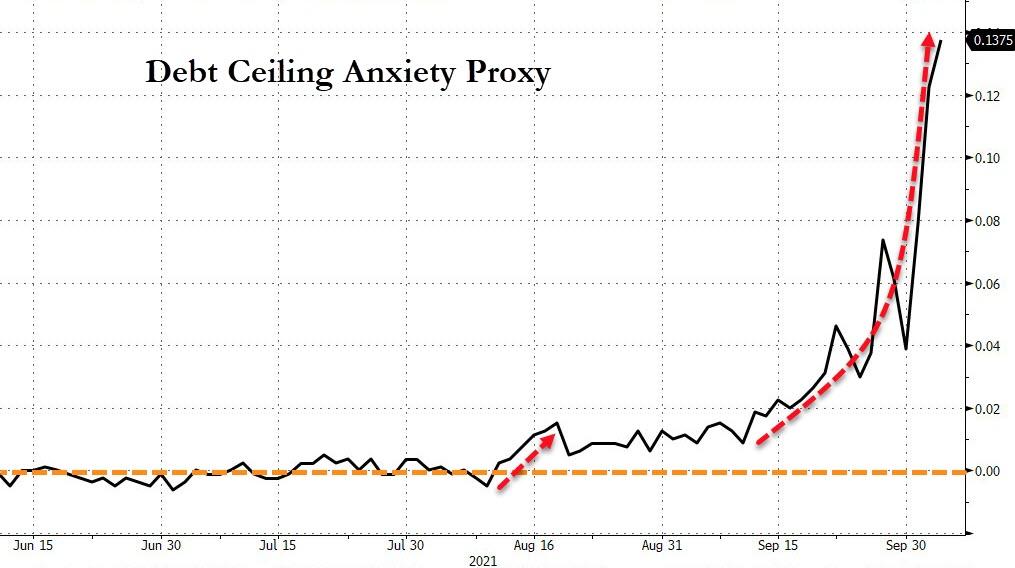
Despite the warm fuzzies that today’s rebound evoked, debt ceiling doubts continue to spread, as this chart shows. Of course, we’ve seen that tug-of-war for decades, followed by last-minute compromises, but it still leaves me wondering “will it be different this time?”
The US Dollar index rallied and bond yields surged, thereby leaving gold in the dust with the precious metal dipping 0.38%.
2. ETFs in the Spotlight
In case you missed the announcement and description of this section, you can read it here again.
It features some of the 10 broadly diversified domestic and sector ETFs from my HighVolume list as posted every Saturday. Furthermore, they are screened for the lowest MaxDD% number meaning they have been showing better resistance to temporary sell offs than all others over the past year.
The below table simply demonstrates the magnitude with which these ETFs are fluctuating above or below their respective individual trend lines (%+/-M/A). A break below, represented by a negative number, shows weakness, while a break above, represented by a positive percentage, shows strength.
For hundreds of ETF choices, be sure to reference Thursday’s StatSheet.
For this current domestic “Buy” cycle, here’s how some our candidates have fared:
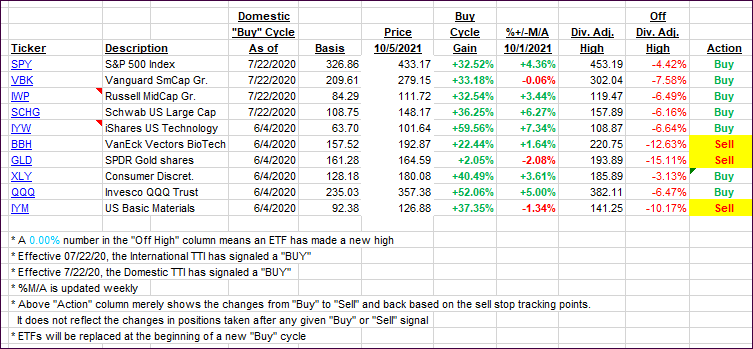
Click image to enlarge.
Again, the %+/-M/A column above shows the position of the various ETFs in relation to their respective long-term trend lines, while the trailing sell stops are being tracked in the “Off High” column. The “Action” column will signal a “Sell” once the -8% point has been taken out in the “Off High” column. For more volatile sector ETFs, the trigger point is -10%.
3. Trend Tracking Indexes (TTIs)
Our TTIs joined in on the rebound rally.
This is how we closed 10/05/2021:
Domestic TTI: +4.59% above its M/A (prior close +3.85%)—Buy signal effective 07/22/2020.
International TTI: +2.29% above its M/A (prior close +1.48%)—Buy signal effective 07/22/2020.
Disclosure: I am obliged to inform you that I, as well as my advisory clients, own some of the ETFs listed in the above table. Furthermore, they do not represent a specific investment recommendation for you, they merely show which ETFs from the universe I track are falling within the specified guidelines.
All linked charts above are courtesy of Bloomberg via ZeroHedge.
Contact Ulli