
ETF Tracker StatSheet
You can view the latest version here.
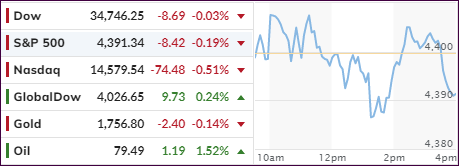
FLAT FOR THE DAY BUT HIGHER FOR THE WEEK
- Moving the markets
It was a good news bad news scenario as the latter, namely a disappointing jobs report faced the former, that is optimism about the short-term debt ceiling bill, which has pushed the ultimate decision into early December.
The jobs report itself offered a similar scenario with the disappointment being the meager addition of only 194k jobs in September, which was well below expectations of 500k.
Coming in as a positive surprise was the unemployment rate, which fell to 4.8%, much lower than forecast, to a level last seen in 2016. Adding to the slightly bullish mood was the August jobs report, which was revised up to 366k from the initial 235k.
It was a volatile week, but equities hung in there despite debt ceiling uncertainty, but be aware that market risk remains due spiking inflation, Covid concerns and exploding bond yields with the weekly chart looking like this.
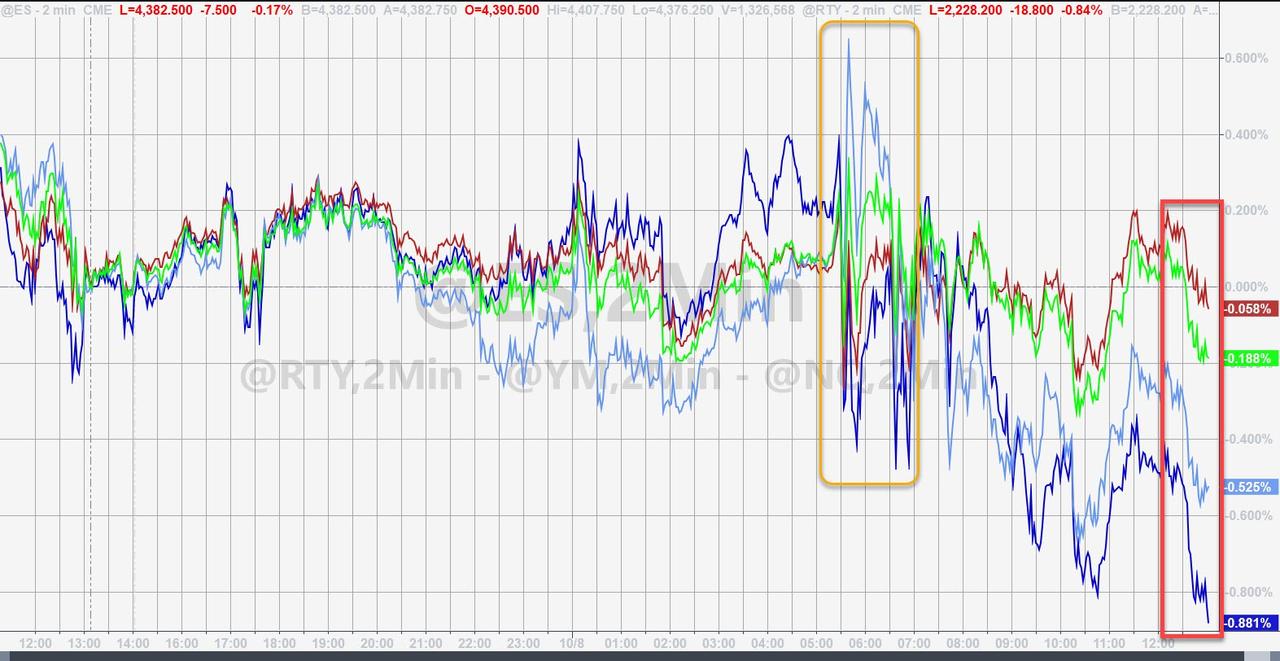
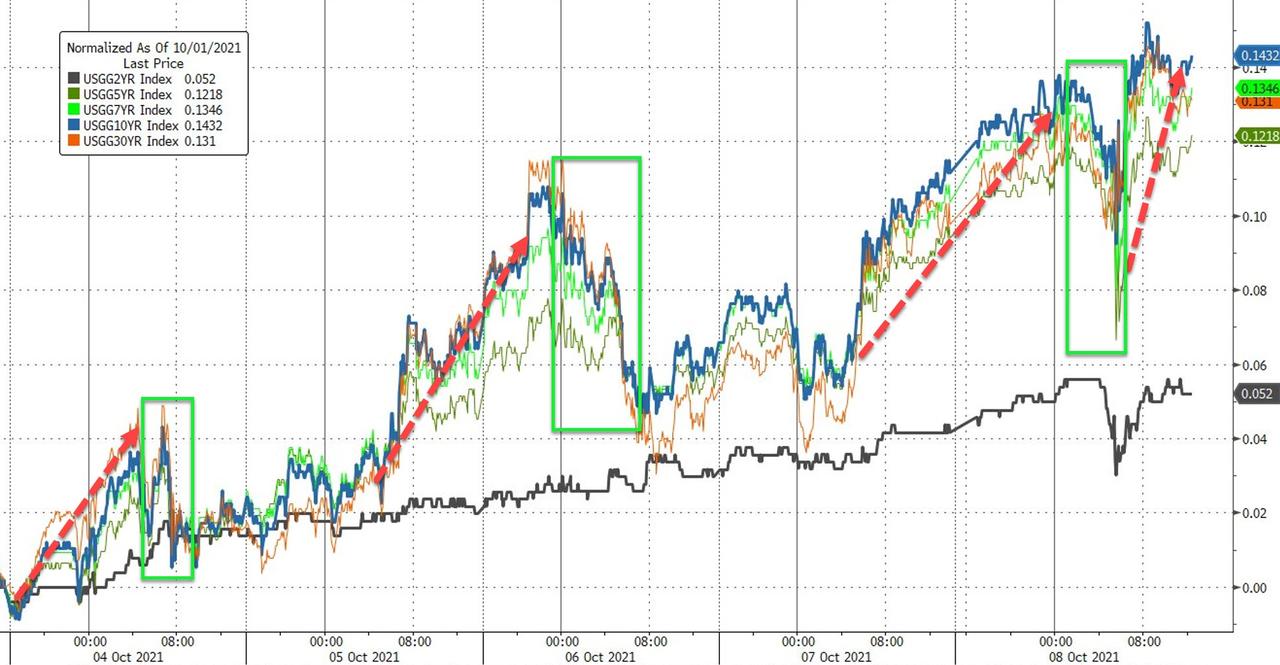
The US Dollar did an about face today, plunging first on news of dismal jobs data but then recovering and ending the week higher. Gold was directionless and ended the week flat.
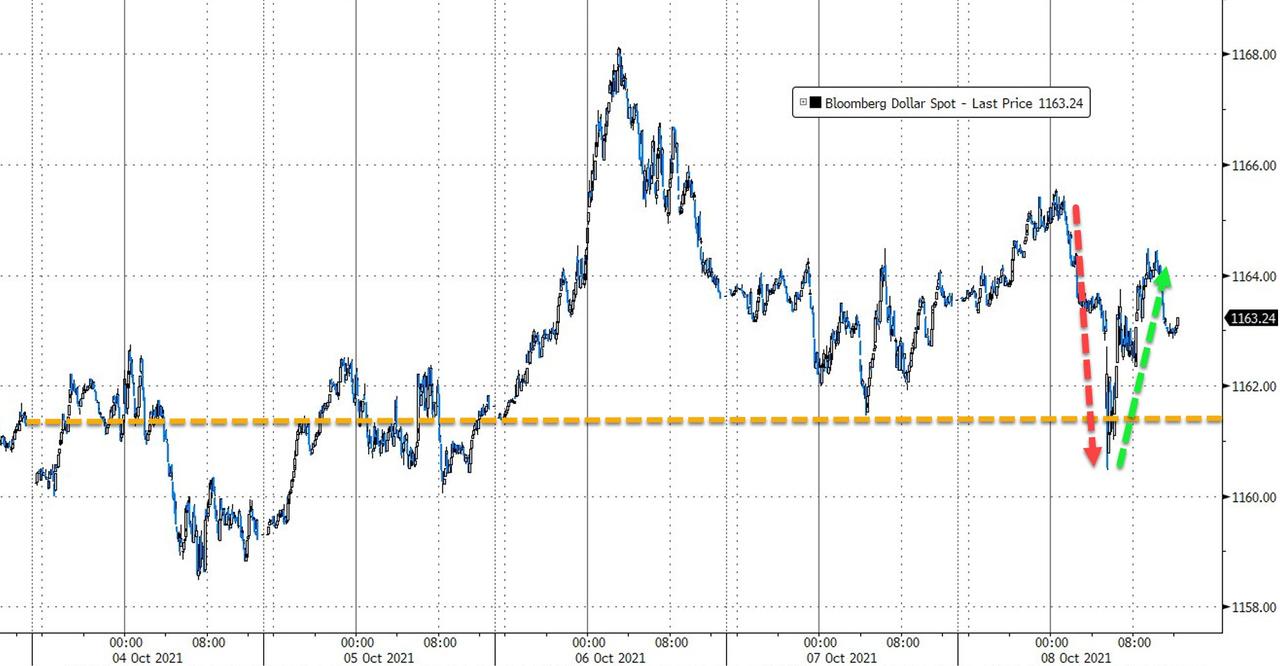
On deck next week is the start of earnings season, which also can offer unexpected surprises.
2. ETFs in the Spotlight
In case you missed the announcement and description of this section, you can read it here again.
It features some of the 10 broadly diversified domestic and sector ETFs from my HighVolume list as posted every Saturday. Furthermore, they are screened for the lowest MaxDD% number meaning they have been showing better resistance to temporary sell offs than all others over the past year.
The below table simply demonstrates the magnitude with which these ETFs are fluctuating above or below their respective individual trend lines (%+/-M/A). A break below, represented by a negative number, shows weakness, while a break above, represented by a positive percentage, shows strength.
For hundreds of ETF choices, be sure to reference Thursday’s StatSheet.
For this current domestic “Buy” cycle, here’s how some our candidates have fared:
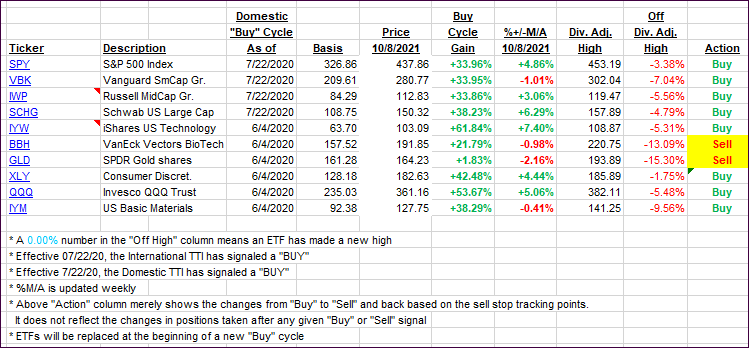
Click image to enlarge.
Again, the %+/-M/A column above shows the position of the various ETFs in relation to their respective long-term trend lines, while the trailing sell stops are being tracked in the “Off High” column. The “Action” column will signal a “Sell” once the -8% point has been taken out in the “Off High” column. For more volatile sector ETFs, the trigger point is -10%.
3. Trend Tracking Indexes (TTIs)
Our TTIs were mixed again with the Domestic one slipping but the international one remaining unchanged.
This is how we closed 10/08/2021:
Domestic TTI: +4.94% above its M/A (prior close +5.62%)—Buy signal effective 07/22/2020.
International TTI: +2.86% above its M/A (prior close +2.86%)—Buy signal effective 07/22/2020.
Disclosure: I am obliged to inform you that I, as well as my advisory clients, own some of the ETFs listed in the above table. Furthermore, they do not represent a specific investment recommendation for you, they merely show which ETFs from the universe I track are falling within the specified guidelines.
All linked charts above are courtesy of Bloomberg via ZeroHedge.
———————————————————-
WOULD YOU LIKE TO HAVE YOUR INVESTMENTS PROFESSIONALLY MANAGED?
Do you have the time to follow our investment plans yourself? If you are a busy professional who would like to have his portfolio managed using our methodology, please contact me directly or get more details here.
Contact Ulli